We have completed maintenance on DiscoverMagazine.com and action may be required on your account. Learn More

Swedes not so homogeneous?

Gene Expression
By Razib Khan
Feb 10, 2011 9:37 PMApr 12, 2023 2:52 PM

Newsletter

Sign up for our email newsletter for the latest science news
 

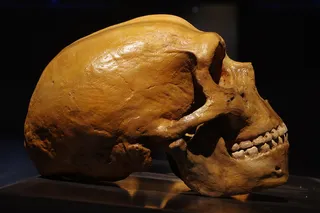
Credit: David Shankbone

The more and more I see fine-scale genomic analyses of population structure across the world the more and more I believe that the “stylized” models which were in vogue in the early 2000s which explained how the world was re-populated after the last Ice Age (and before) were wrong in deep ways. I’m talking about the grand narratives outlined in works such as Bryan Sykes’ The Seven Daughters of Eve, the subtitle of which was “The Science That Reveals Our Genetic Ancestry.” If I had less faith in science to always ultimately right its course I’d probably become a post-modernist type who asserts that all these stories are fictions. Sykes’ model in particular seems to be very likely incorrect because of the utilization of ancient DNA to elucidate population movements past in Europe. From what we can gather it looks like coarse attempts to infer past distributions from current distributions (of specific lineages and their diversity) resulted in a great deal of false clarity. We’re not talking differences on the margins, but fundamental confusions. For example, Basques were always assumed to be a viable “reference” population for descendants of European hunter-gatherers. This was one of the linchpins of older historical genetics models. It turns out that this fixed assumption may have been a false one.

Not only were our past assumptions in simple models wrong, but the real explanations may also be rather complex. It turns out that ancient DNA of the “first farmers” and their “hunter-gatherer” neighbors in Central Europe reveals a lot of discontinuity between both these groups and modern Europeans. Why? It may be that in fact there were multiple migrations, and the palimpsest is going to be a tough cookie to excavate. But there’s no need to be disheartened, the old paradigms came crashing down thanks to data.

With that in mind I’ve been particularly interested in the European fringe, the far west and north. If any hunter-gatherer descendants survive in large numbers, it will be here. This is why I’m curious as to the genetics of the Sami as well as the archaeology which tracks the spread of agriculture in Northern Europe. A new paper in PLoS ONE focuses on SwedenSwedish Population Substructure Revealed by Genome-Wide Single Nucleotide Polymorphism Data:

The use of genome-wide single nucleotide polymorphism (SNP) data has recently proven useful in the study of human population structure. We have studied the internal genetic structure of the Swedish population using more than 350,000 SNPs from 1525 Swedes from all over the country genotyped on the Illumina HumanHap550 array. We have also compared them to 3212 worldwide reference samples, including Finns, northern Germans, British and Russians, based on the more than 29,000 SNPs that overlap between the Illumina and Affymetrix 250K Sty arrays. The Swedes – especially southern Swedes – were genetically close to the Germans and British, while their genetic distance to Finns was substantially longer. The overall structure within Sweden appeared clinal, and the substructure in the southern and middle parts was subtle. In contrast, the northern part of Sweden, Norrland, exhibited pronounced genetic differences both within the area and relative to the rest of the country. These distinctive genetic features of Norrland probably result mainly from isolation by distance and genetic drift caused by low population density. The internal structure within Sweden (FST = 0.0005 between provinces) was stronger than that in many Central European populations, although smaller than what has been observed for instance in Finland; importantly, it is of the magnitude that may hamper association studies with a moderate number of markers if cases and controls are not properly matched geographically. Overall, our results underline the potential of genome-wide data in analyzing substructure in populations that might otherwise appear relatively homogeneous, such as the Swedes.

Playing around with ADMIXTURE I’m now happy to see 350,000 SNPs, but less assured by 29,000 SNPs. After a bunch of pruning I have a data set where individuals have 100,000 SNPs, and that seems marginal when it comes to differentiating variation in Western Europe among populations, though I suppose I didn’t do it very intelligently (i.e., I didn’t try to bias toward ancestrally informative markers).

A major “top line” finding of this paper is that Swedes exhibit more geographical substructure than more numerous populations inhabiting expansive Central European regions. Additionally, though not as distinctive as Finns vis-a-vis other Europeans, they are somewhat distinctive, especially those in the north. The bar plot to the left is generated by STRUCTURE, and you see set sets of populations at particular K’s, each K being a putative ancestral group.

The differentiation within Sweden is evident at higher K’s. That’s striking because notice that the Germans and British don’t exhibit the pattern (they state in the paper that they looked for geographical patterns). But for me what is striking is the disjunction between Scandinavians and continental Germans, and the relative lack of one between the British and the Germans. At K = 5 a difference does crop up. At the top you see Russians, so it looks like blue = Eastern European, while red = Western European, and the Germans are a mix of the two, with the Russians and British representing extreme “types” (again, these are very stylized facts, there are no pure “types). But the break with Swedes occurs at lower K’s. Why? The first thought is water. Water blocks gene flow a great deal, but then what about Britain? I doubt all the sampling in Britain was from the old Saxon Shore of East Anglia! I will hazard a rather general explanation: maybe it’s agriculture! More specifically, the switch to agriculture may have occurred via different demographic processes in the two locales. Britain has a milder climate than Sweden, and could presumably support a more dense transplanted culture more easily than Sweden.

Let’s look at the data in a different way. The figure to the left shows the top two dimensions of variation in the data. The x axis explains 0.64% of the variance, and the y axis 0.24% (these are genetically close groups remember). The bottom left of the distribution consists of Germans, the top of the point the Russians, and to the far right eastern Finns. Finns are something of a European outlier, along with Basques and Sardinians, but it is interesting how much greater east-west distances correspond to less variance than north-south at this scale. On the broader trans-European level north-south differentiation is usually more significant than west-east. Why? I think geography explains it, the Mediterranean and the Atlantic fringe allowed for a rapid expansion of agriculturalists in Southern Europe from their point of origination in Anatolia. The move north was slower, and involved more amalgamation with hunter-gatherers. But, within Northern Europe there were local differences. Inland North European plain with its rich soil and riverine network may have allowed for a great deal of demographic expansion in the face of an extremely thin pre-Neolithic population. But, they met another point of resistance at the oceanic fringe, where maritime resources were great enough to support denser hunter-gatherer populations. This, I suspect, explains the discontinuity at the Kattegat and Skagerak.

Let’s take another look at genetic distance. The visualization to the left is a representation of the Fst between pairs of populations. I’ve added labels. Fst just measures the proportion of genetic variance which can be partitioned between groups. The x axis is the first dimension, and the y the second. That geography is not always a good predictor of genetic distance. Look at how close the sample for Orkney (off the coast of northern Scotland), the British, Germans, and the Utah whites (who are mostly British and German in origin) cluster in terms of genetic distance. In contrast, the French and French Basques differ a great deal.

To illustrate the weirdness of some of the patterns, like a 5 year old I took a blank map of Europe and just drew a line from region to region based on distances on the first dimension (x axis). So you see a zig-zag in Western Europe, a sweep to the east, and finally the terminus in the east of Finland. You’d be surprised how often I want to scribble on a map nonsensically when I see some of the SNP-chip data. Yes, geography does correspond to genetic distance, roughly, but some of the deviations from expectation are really weird. Sardinians and Finns in particular seem to be the extreme points on some broad underlying pattern of genetic variance in Europe. But, obviously the Basques also represent another dimension. A simple model is bound to be wrong, but a complex one is going to be wrong in a lot of the details.

Finally, we’ve been talking about ancestry only. What about functionality? Genes sometimes after code for differences, some of them visible, and many of them significant. Not surprisingly ancient hunter-gatherers who were resident in Sweden were lactose intolerant. Why would they need to be able to digest milk as adults if they didn’t have herds of cattle?

By and large the authors didn’t find much functional significant in the sharp north-south difference in Sweden. But, there were some suggestions (there’s some issues with the statistical likelihood due to the lack of particular precautions which would mitigate against false positives):

Why the differentiation? I think this is a clear case of “maybe it’s agriculture.”Northern Sweden was not ethnically cleansed and assimilated of its Sami until the early modern period. These were traditionally non-agricultural people, the closest Europe had to hunter-gatherers (since they herded reindeer they obviously weren’t hunter-gatherers). Some of the difference may simply be a Sami substrate in the north of Sweden, with all the functional differences entailed due to the lack of thousands of years of dense agriculture life.

Citation: Salmela E, Lappalainen T, Liu J, Sistonen P, & Andersen PM (2011). Swedish Population Substructure Revealed by Genome-Wide Single Nucleotide Polymorphism Data PLoS ONE : 10.1371/journal.pone.0016747

1 free article left
Want More? Get unlimited access for as low as $1.99/month

Already a subscriber?

Register or Log In

1 free articleSubscribe
Discover Magazine Logo
Want more?

Keep reading for as low as $1.99!

Subscribe

Already a subscriber?

Register or Log In

More From Discover
Recommendations From Our Store
Shop Now
Stay Curious
Join
Our List

Sign up for our weekly science updates.

 
Subscribe
To The Magazine

Save up to 40% off the cover price when you subscribe to Discover magazine.

Copyright © 2024 Kalmbach Media Co.