We have completed maintenance on DiscoverMagazine.com and action may be required on your account. Learn More

Nine Days of California Infernos, as Seen from Space

ImaGeo iconImaGeo
By Tom Yulsman
Nov 2, 2019 2:30 PMNov 21, 2019 11:39 PM
NASA california wildfire
(Credit: NASA Worldview)

Newsletter

Sign up for our email newsletter for the latest science news
 

The Kincade Fire has been the most destructive of California infernos so far this year. But other damaging blazes have erupted too, including six in the Los Angeles area alone.

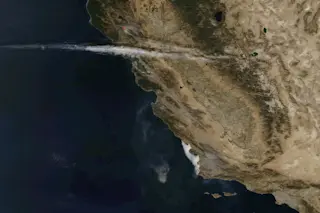
You can watch the evolution of these blazes in the animation above. I created it using imagery acquired by a trio of spacecraft: NASA’s Terra and Aqua satellites, and the Suomi-NPP satellite.

Make sure to click on the animation in order to enlarge it enough to get the best possible view.

Please click on this animation of satellite images to see an overview of California wildfires from Oct. 23 to Nov. 1, 2019. Look for bluish smoke plumes as well as red dots marking areas where the satellites detected fire. The Kincade fire erupts in the north on Oct. 24th, as does the Tick Fire near Los Angeles, at lower right. Later in the sequence, five other blazes ignite in the L.A. area. (Images: NASA Worldview. Animation: Tom Yulsman)

The animation starts on Oct. 23. On this day, no fires are visible. It then runs through Nov. 1. Look for bluish smoke plumes as well as red dots marking areas where the satellites detected the heat signature from fire.

In the animation, the hot spots and smoke plume from the Kincade Fire can be seen clearly in the north starting on Oct. 24. Over ensuing days, the blaze waxes and wanes and then blows up again, controlled in large measure by weather and also the heroic efforts of firefighters to contain it.

As of Nov. 2, the Kincade Fire has destroyed 372 structures and scorched 121 square miles. That’s an area approaching half the size of New York City. The fire is now 72 percent contained.

The Tick Fire near Santa Clarita north of Los Angeles also ignited on Oct. 24th. Red dots indicative of heat from the blaze become visible in the lower right portion of the animation on the next day. This blaze went on to destroy 27 structures.

Also in the Los Angeles area, the Getty Fire erupts on Oct. 28th. Then the Easy Fire pops up on Oct. 30th.

The Easy Fire came within a few feet of the Ronald Reagan Presidential Library. The structure was spared in part because of a fire break created by goats. The animals had been brought in previously to graze on brush in a perimeter around the library to reduce wildfire risk.

I can also make out hot spots from the Hillside Fire and 46 Fire, both of which ignited on Oct. 31. The former began north of San Bernardino and the latter near Riverside. No smoke plumes are evident in the satellite imagery from these blazes.

Another fire also blew up on Oct. 31: the Maria Fire near Santa Paula in Ventura County. The heat of that dangerous blaze as well as its smoke plume becomes visible in the animation on the next day.

As I’m writing this on Nov. 2, the Maria Fire has scorched about 9,400 acres — more than half the size of Manhattan. It is just 20 percent contained.

As more remote sensing imagery of California infernos becomes available, I’ll post some of it here. So I hope you’ll check back.

1 free article left
Want More? Get unlimited access for as low as $1.99/month

Already a subscriber?

Register or Log In

1 free articleSubscribe
Discover Magazine Logo
Want more?

Keep reading for as low as $1.99!

Subscribe

Already a subscriber?

Register or Log In

More From Discover
Recommendations From Our Store
Shop Now
Stay Curious
Join
Our List

Sign up for our weekly science updates.

 
Subscribe
To The Magazine

Save up to 40% off the cover price when you subscribe to Discover magazine.

Copyright © 2024 Kalmbach Media Co.