Winston has killed at least 21 people and caused great damage in Fiji. Here are the roles played by El Niño, climate change, and other factors in the evolution of this fierce — and very strange – storm.
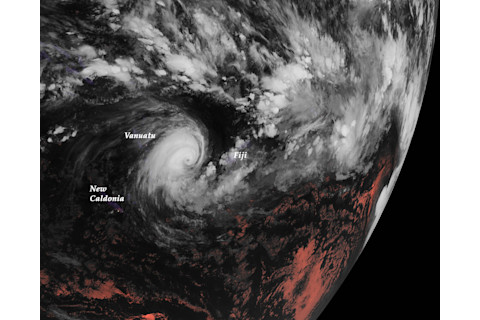
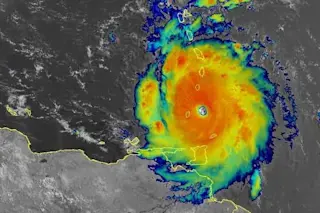
An image captured by the Himawari-8 satellite shows Tropical Cyclone Winston at 15:40 a.m. UTC (10:40 a.m. EST in the U.S.) on Sunday, Feb. 21, 2016. At this time, the storm was making a transition from a Category 4 to a Category 2 tropical cyclone. In this nighttime "geocolor" image, white colors are indicative of ice in the higher parts of clouds; reddish colors show lower-level liquid water in clouds; city lights are shown in yellow. Click on the image to open it in a new tab, then click again to enlarge. If you look closely, you can make out landmasses, such Grand Terre, the main island of New Caledonia, and Fiji as well. (Raw image: NOAA/RAMMB/CIRA)
| See update at the end of this post concerning Winston's ranking among tropical cyclones |
Winston was born as a tropical storm a little east of Vanuatu in the South Pacific, way back on February 10th. Little did we know then just how strange — and strong — this storm would become, thanks to multiple influences, including climate change. This is the story of Winston's birth and evolution, and the factors that helped turn it into one of Earth's fiercest storm's on record. With initial winds of about 40 miles per hour, Winston cruised south and gathered strength quickly, becoming a Category 3 cyclone by the 12th. Curving to the northeast, the storm waned for a bit.
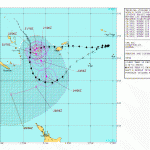
Source: JTWC And then, something really weird happened — a prelude to the cyclone's scary transformation into the strongest storm on record in the Southern Hemisphere. (Click on the thumbnail at right for a map of Winston's circuitous trek through the South Pacific.) Tracking eastward over the warmest waters in the Pacific Ocean basin, Winston strengthened again — and turned on a dime, crossing over Tonga for a second time. Heading due west, it exploded in strength — with Fiji in its crosshairs. On the morning of Saturday, Feb. 20, 2016 (local time), Winston first hit the sparsely populated Fijian island of Vanua Balavu, and then at 2 p.m. local time (9 p.m. EST Friday) it roared across Koro with sustained winds of 185 mph. That made Winston second only to Super Typhoon Haiyan as the strongest cyclone to make landfall anywhere on Earth in recorded history. But he wasn't finished yet. Next Winston skimmed along the north coast of Viti Levu, Fiji's biggest and most populous island, smashing villages to bits. Before Winston finally headed out to sea, the storm had left at least 21 people dead. As of Monday evening on Fiji, thousands of people were still in shelters. The image at the top of this post shows what the cyclone looked like from space as it moved out to sea away from Fiji. It was acquired at 3:40 a.m. local time on Monday, Feb. 22 (10:30 a.m. EST the previous day) by the Himawari-8 weather satellite. Although Winston is not particularly large, the storm certainly was one of the fiercest that anyone has ever experienced on this planet. How did it get that way? Overall, four major factors were at play. Each operates over a different timescale, and so exerted its influence in different ways and to a different degree. I'll tackle each one in some detail, with help from Kevin Trenberth, a renowned scientist at the National Center for Atmospheric Research who focuses on global energy and water cycles, and how they are changing. But first, here are those four factors: On a timescale of decades, we have human-caused climate change. This is not to say that climate change caused the storm. But the greenhouse gases that have accumulated in the atmosphere from human activities have made more heat energy and water vapor available to storms. More about this in a minute. Next, there's El Niño, which operates at an annual timescale. It has caused a broad warming of surface waters in the central and eastern Pacific. Winston certainly drew strength from these warm waters. We're also in the midst of something called the "Madden-Julian Oscillation," which is intra-seasonal in nature, meaning it comes and goes in a matter of weeks. And right now, the MJO is bringing enhanced storminess to the central and western Pacific — including the area where Winston spun up. Lastly, we have good old-fashioned day-to-day natural variability, aka “weather” (which, of course, is shaped by the other factors). So now, let's tackle climate change in detail. It has affected the background state of Earth's climate system by causing a long-term increase in the amount of heat stored in the ocean, and also by allowing the atmosphere to hold more water vapor. Both can enhance storminess. I asked Trenberth to tell me the most accurate way to describe the impact on tropical cyclones — because I didn't want to go too far in making a connection where none exists. Here are excerpts of his responses (with a little editing for clarity):
Yes, the memory is in the ocean heat content, which has increased and continues even after all the embroidery of storms etc. occurs nears the surface.
In other words, winds, currents, the passage of storms, and other factors (including those I describe below) all can influence the temperature of sea water at the surface. Meanwhile, over the decadal timescale, the oceans have absorbed some 93 percent of the heat generated by our greenhouse gas emissions — and that's a whole lot of energy. As Climate Central's Brian Kahn explains it:
. . . the average annual energy absorbed by the upper ocean alone equals 43 times the amount of energy the U.S. consumed in 2012, the most recent year with data available.
What impact has this had on sea surface temperatures, or SSTs? And what has been happening to the water vapor content of the atmosphere? Here's Trenberth's answer:
Global SSTs have increased by about 0.7 C since the 1970s, and water vapor over the oceans is up by 6% or more . . . The other aspect is that the sea level is also higher (but moves around a lot with winds). This adds to storm surge.
How much of an impact does this have? Trenberth addressed that question at a presentation I saw him give on Friday. Here was his answer:
I’m not saying climate change is a cause of any of these things. What climate change does is make things a little more intense, a little stronger.
Next up, El Niño. In my email to Trenberth I noted that El Niño has raised sea surface temperatures in the central and eastern equatorial Pacific. "But I’m not sure whether this was a factor in Winston, which I think spun up a bit to the west of El Niño’s main influence," I wrote. "But perhaps I’m wrong?"
I was:
No — I would certainly include El Niño. That stems back to March, 2015 when Pam devastated Vanuatu: The exceptionally high sea surface temperatures of over 30 C in that area would never occur without El Niño. Same [with Winston]: El Niño is a factor in the high SSTs around the dateline.
The Madden-Julian Oscillation has also played role, but unlike El Niño — which sticks around for a year or more — the influence of the MJO on a given region in the Pacific passes in a matter of a couple weeks.
Before I get to Trenberth's comments about its influence on Winston, I think a little MJO primer is in order.
I wrote about it in an earlier post about how the MJO might give a temporary boost to El Niño's influence on California. Here was the headline (click on it to go to the story): The Godzilla El Niño now drenching California is getting a boost from another potent climatic phenomenon: ‘MJO’
In that piece, I offered meteorologist Jon Gottschalck's explanation of the MJO. It is, he said, “an eastward moving disturbance of clouds, rainfall, winds, and pressure that traverses the planet in the tropics and returns to its initial starting point in 30 to 60 days, on average.”
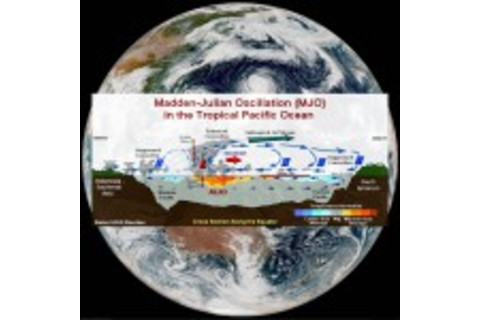
(Earth image: Japan Meteorological Agency. Diagram: National Weather Service)
Click on the thumbnail to the left for a graphic that explains what happens once the active MJO region has moved east from the Indian Ocean, past Southeast Asia, and out toward the central Pacific.
As the graphic shows, in the active MJO region, air currents rise over warm waters, causing clouds to form in big convection cells. Meanwhile, convection activity is suppressed behind and ahead of this area of increased storminess. Since I wrote that piece back in early January, the active phase of the MJO has returned to the Pacific. And Cyclone Winston spun up in an area of the ocean basin where it has enhanced storminess quite a lot. Check out this visualization of what's been happening (but see the annotation first):
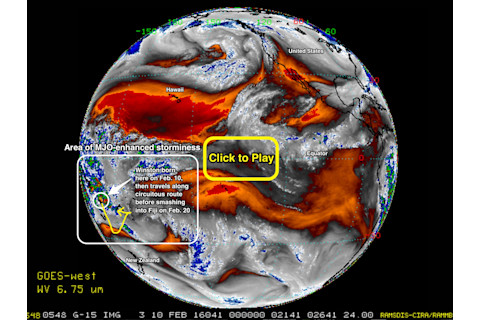
Animation of infrared images from the GOES-West satellite showing the evolution of Tropical Cyclone Winston in a region of MJO-enhanced storminess. (Source: RAMSDIS-CIRA/RAMMB) I annotated the first frame of this animation of GOES-West weather satellite imagery to show where Winston was born, along with its subsequent long, strange trip through a region of the South Pacific where storminess has been enhanced by the Madden-Julian Oscillation. The blue and green colors with embedded splotches of bright yellow and red are indicative of higher levels of atmospheric water vapor — and enhanced storminess. Duller orange and red indicates less water vapor. Ok, back now to Kevin Trenberth's explanation of role MJO played in Winston's evolution:
The MJO consists of cloud clusters often called "mesoscale convective systems" (or complexes), and commonly abbreviated as "MCCs" or "MCSs". They are basically a non-rotating convective complex, but they help each other in various ways . . . These form a core disturbance.
The current active phase of the MJO was a disturbance that helped spawn the vortex pattern of winds that contributed to the birth of Winston, according to Trenberth:
. . . all tropical storms and hurricanes seem to require some form of finite amplitude disturbance to help get the vortex going . . . So the MJO in this case spun off a piece that formed the core that started to rotate and pull in moisture from the outside. . .
Okay, I think it's time for a recap:
Over the long run (decades), human-caused climate change has increased oceanic heat and atmospheric water vapor, thereby influencing the background climatic state that all weather phenomena occur in.
Over a year, give or take, El Niño has warmed Pacific ocean waters even farther, throwing more fuel on the cyclonic fire.
Over the past couple of weeks, the Madden-Julian Oscillation has punched up storminess in the western and central Pacific, and spun off a disturbance that ultimately became Tropical Cyclone Winston.
But wait! One more thing is missing: good old-fashioned day-to-day natural variability, aka “weather." What role did it play? Remember that long, strange trip Winston took? He was born as a tropical storm on February 10, then wandered south, got stronger, got weaker, turned to the northeast, got stronger, stronger still, took an about face, etc... This evolution certainly was shaped by the bigger patterns we've just discussed. But there's also simply the day-to-day vagaries of winds, ocean currents, temperature, etc. And were it not for those, the trip might not have been so strange. Or it could even have been stranger. | Update Feb. 22, 2016: After I posted this story, I became aware of a bit of a debate about whether Winston really was the strongest cyclone on record in the Southern Hemisphere. Jason Samenow at the Washington Post's Capital Weather Gang addresses this issue in this excellent overview: "Fiji reeling after devastating Cyclone Winston, among the strongest ever to strike land."
As he points out:
According to records from the Joint Typhoon Warning Center, Winston ranks as the strongest on record to occur in the Southern Hemisphere. Note, however, “reliable” intensity information only dates back to about 1990 according to Phil Klotzbach, a tropical cyclones expert at Colorado State University and contributor to the Capital Weather Gang.
Bob Henson at Weather Underground also offers an excellent overview of the storm and its impacts, as well as the issue of its ranking: "Incredible Destruction and at Least 21 Deaths in Fiji From Tropical Cyclone Winston"
|


