

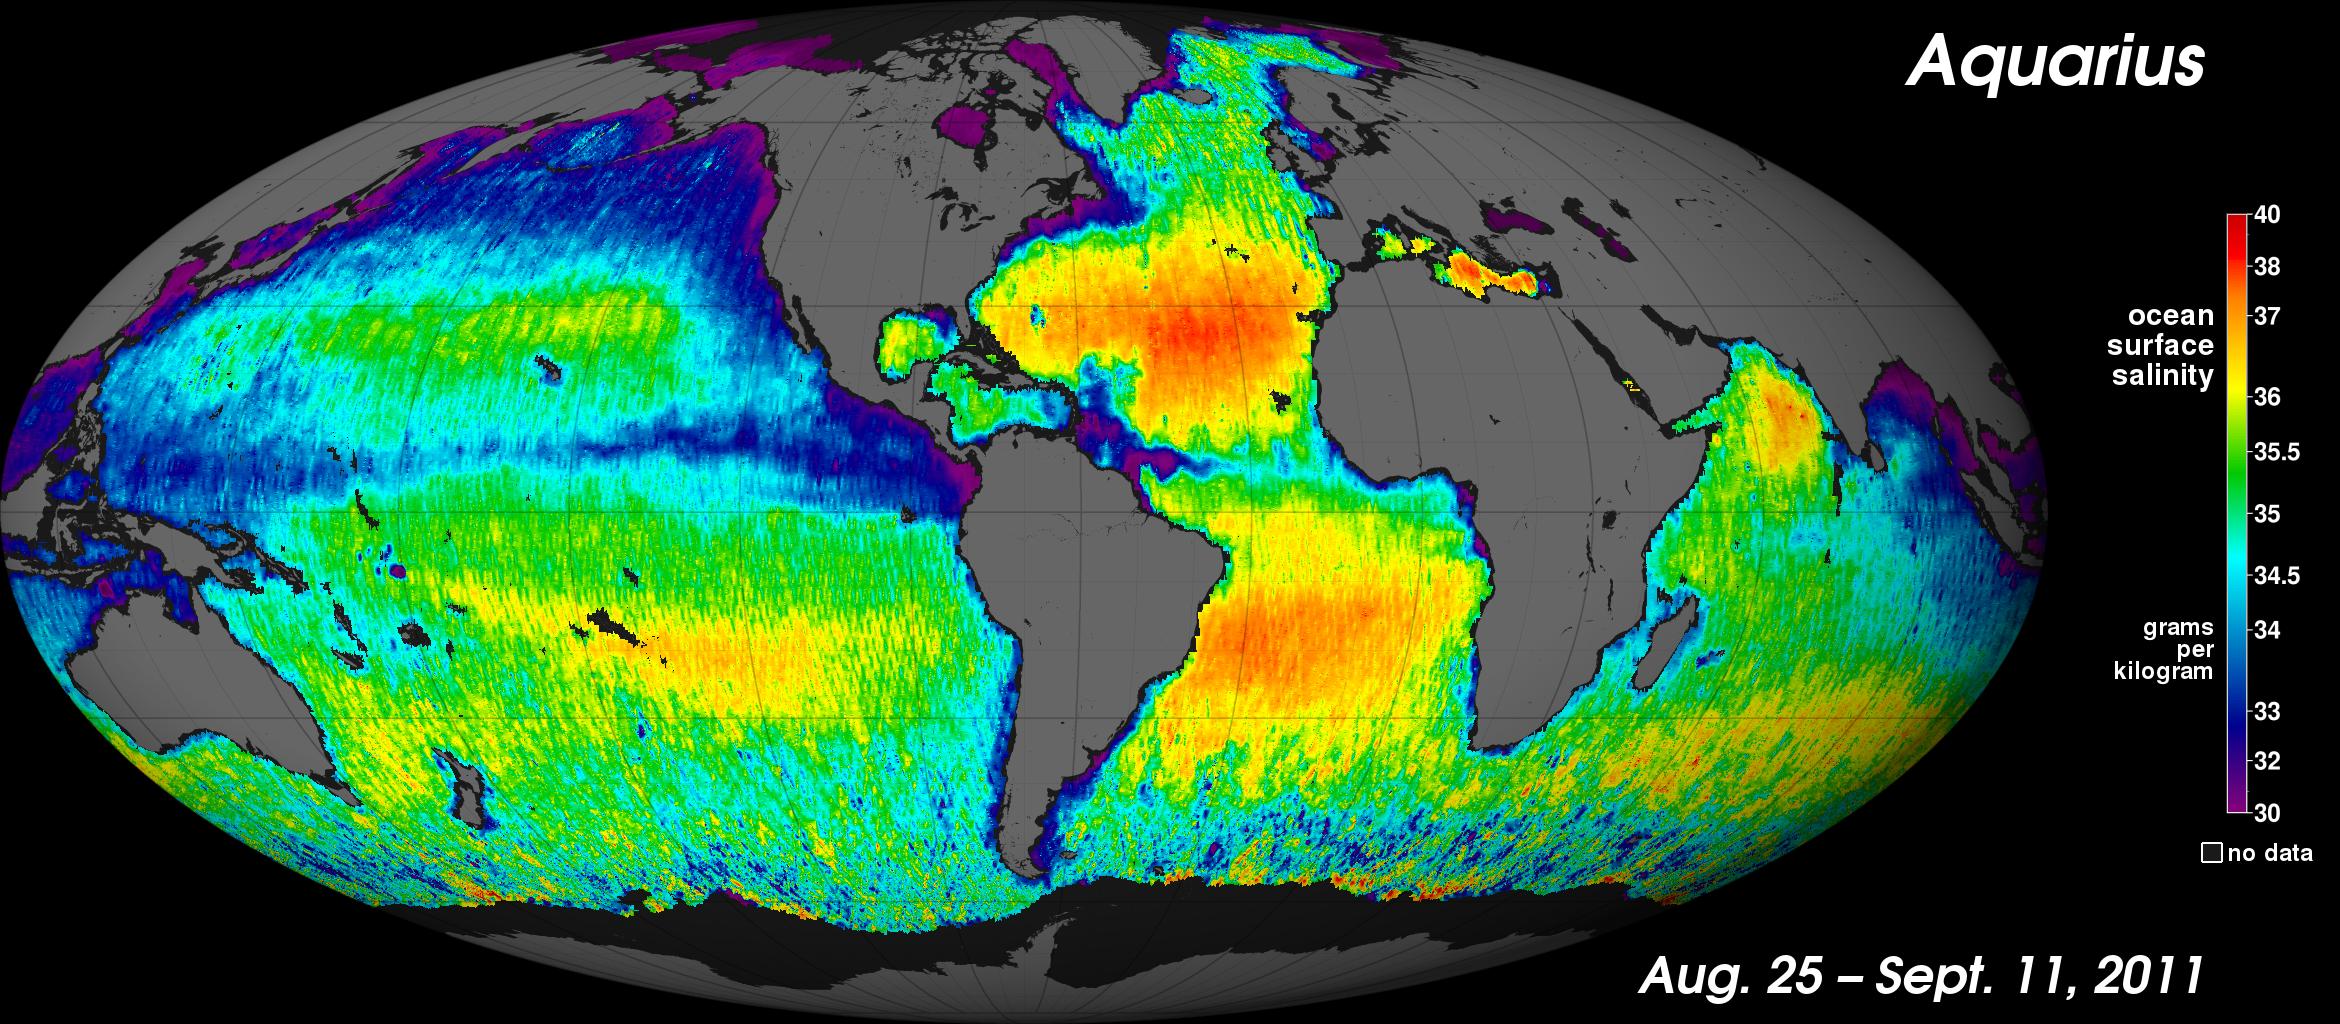
In June, NASA launched the Earth-observing satellite Aquarius, designed to observe and measure the salinity content of the ocean surface. This turns out to be important because salty water flows differently than pure water, and how the currents interact drives a lot of the way heat is transferred across the Earth's oceans. And that drives a lot of climate behavior, including climate change. Scientists just released the first global map of ocean surface salinity, showing surprising (to me) variations across the planet:
Neat! [Click to verucafy.] In the map, blue/purple is lower salinity, and red/orange is higher concentrations. The average value is about 35 grams of salt per kilo of water (about 0.6 ounces of salt to one pint of water), but it varies a lot. And it's not just latitude dependent, which would've been my first guess. The Pacific equatorial waters are low in salt, but the levels in ...


