Over the past few months I was hoping more people would start doing what Zack Ajmal, Dienekes, and David, have been doing. There are public data sets, and open source software, so that anyone with nerdy inclination can explore their own questions out of curiosity. That way you can see the power and the limitations of genomics on your own desktop. I wonder if one of the biggest reasons that more people haven’t started doing this is formatting. It can be a pain to convert matrix formatted files into pedigree format, for example. But the data gusher isn’t ending, look at what’s coming out (and has come out) in the 1000 Genomes project!
I’ve been thinking I need to write up a post which is a “soft landing” for people so that we can reduce the “activation energy” for this sort of thing…once you get hooked, you only go deeper. Luckily an anonymous tipster has sent me the link to a URL with a huge data set which has been merged, already pedigree formatted. Here are the populations:
!KungBuryatsHausaMadaPunjabi ArainTotonacAdygeiCambodianHazaraMakraniPygmyTuAfrican AmericansChineseHemaMalayanRomaniansTujiaAlgeriaChinese AmericansHezhenMandenkaRussianTunisiaAltaiansChukchisHungariansMayaSahara OccTurksAlurChuvashsIbanMbutiSakilliTuscansAp BrahminCochin JewsIgboMelanesianSamaritiansTuviniansAp MadigaColombianIranian JewsMexicansSamoanUrkarahAp MalaCypriotsIraniansMiaoSanUtahn WhitesArmeniansDaiIraq JewsMongolaSan NbUygurArmenians BDaurIrulaMongoliansSandaweUzbekistan JewsAshkenazy JewsDogonItalianMoroccansSardinianUzbeksAzerbaijan JewsDolgansJapaneseMorocco JewsSaudisVietnameseBalochiDruzeJordaniansMorocco NSelkupsGreenlandersBambaranGreenlandersKabaMorocco SSephardic JewsXhosaBamounEgyptKalashMozabiteSheXiboBantukenyaEgyptansKaritianaN EuropeanSindhiYakutSouth AfricaEthiopian JewsKetsNaxiSingapore ChineseYemen JewsBasqueEthiopiansKhmerNepaleseSingapore IndiansYemeneseBedouinEvenkisKongoNganassansSingapore MalayYiBeijing ChineseFangKoryaksNguniSlovenianYorubaBelorussianFrenchKurdNorth KannadiSotho/TswanaYukaghirsBiakaFulaniKyrgyzstaniOrcadianSpaniards Bnei MenasheGeorgia JewsLahuOroqenStalskoe BolivianGeorgiansLebanesePalestinianSurui BrahuiGujaratisLezginsPaniyaSyrians BrongGujaratis BLibyaPapuanThai BulalaHadzaLithuaniansPathanTamil Brahmin BurushoHanLuhyaPediTamil Dalit BuryatHan NchinaMaasaiPimaTongan
The data set has ~4,000 individuals, and ~30,000 markers. The binary file is ~25 MB. The download has four files. The .bed, .bim, and .fam, are pedigree formatted. The .csv is a “master list” of the information on each individual (population, region, etc., tied to a specific identification number). This is important because once you have some output files…you need to figure out what it means, and visualize it, and that’s only informative if you have a master list with more than just family and individual information.
Here is the link to the file to download with all the above populations. I’ve pulled it down and run it, so I know it’s not malware.
So what now? The post will be divided into three portions.
1) Running this data in ADMIXTURE
2) Visualizing it in R
3) Manipulating this data in Plink
#1 is not contingent on #2 and #3, so I’ll do that first. You don’t need to read #2 and #3. In fact some of you might be really good at manipulating spreadsheet formatted data, so it might not be needful to go to #2. But in the R section I’ll also have a easier spreadsheet output for you, so even if you don’t care for R’s visualization, you’ll at least have a better to manage set of .csvs. #3 matters if you want to constrain your data set, and also add your own 23andMe file to the end of it.
#1 Running the data in ADMIXTURE
First, you need Linux or MacOS. If you are on Windows, the Wubi application allows you have to have a dual boot. It runs Ubuntu Linux next to Windows, and you can uninstall it as if it is a Windows application.
I am doing this on Ubuntu Linux, for your information. Assuming you have the right operating system, now you need ADMIXTURE. You can put the folder anywhere.
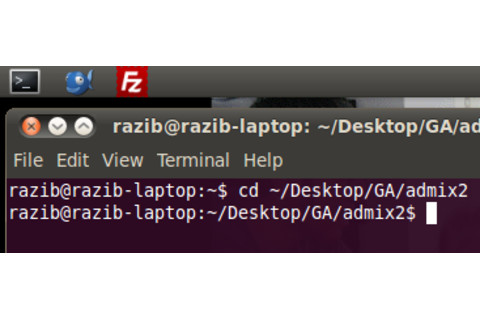
razib
You need to use the terminal to go to the folder where you have ADMIXTURE. The image to the left shows me doing so. You need to click the terminal application, and ender the “cd” command to get to the appropriate folder. My ADMIXTURE program is on the Desktop, within the “GA” folder, and the “admix2” subfolder. So I typed what you see. The “cd” command moves you around the folders, up and down. Google it if it confuses you, though without knowing what it does it should be fine if you just extract ADMIXTURE to the Desktop, and you type “cd Desktop”. This will clutter up your desktop in the future…but if you need to get some stuff done ASAP without knowing how to navigate in Linux, that should work
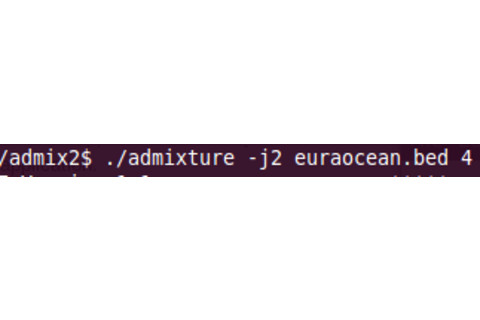
runadmix
So now you have ADMIXTURE, and the files which ADMIXTURE is going to analyze. What do you do? You need to make sure that ADMIXTURE and your files are in the same folder/location. So if ADMIXTURE is on the Desktop, just extract the files to the Desktop. Now you need to run a command. You see a screenshot of me running ADMIXTURE. You may need to omit the ./ (i.e., “admixture” vs. “./admixture”). You see the file name. The option -j2 is due to the fact that I have two cores. If you don’t know what that means, just omit it. It speeds up the run though. The last number is the K. So this is for K = 4.
Now the program will run. How long depends on the size of the file, and the number of K’s. I often run the program overnight for larger K’s. If you want to get fancy and do stuff like cross-validation, it will take even longer. Be warned. The screenshot to the left is typical of what you’ll run in to as ADMIXTURE does its thing. No worries, the algorithm is running. If you watch long enough you’ll get a sense of what values on the screen point to a high likelihood that it’s almost done, and you can start anticipating the output files from which you can make inferences.
Completion! To the right is what you’ll see when ADMIXTURE is done. As noted, there are output files. This is what is really interesting & useful, but even on this screen there’s goodness. The primitive matrix shows you Fst distances between putative ancestral populations. Fst is measuring the proportion of variance within the data set which can be attributed to between population variance. The smaller the value, the less the magnitude of differences between two populations. On this screen you see four populations, since I set K = 4. The Fst is generated from ancestral allele frequencies, which are within the output files. Remember, these are distances between abstract populations, not real ones.
The original files were euraocean.bed, euraocean.bim, and euraocean.fam. So the output files are like so:
euraocean.4.Q euraocean.4.F
The 4 represents the K. The first file has a list of the proportions for putative ancestral populations for each individual in the data set, the individuals being on separate lines. The second file has all the allele frequencies for the ancestral populations, generated by the parameter K.
What do you do with this? euraocean.4.Q is related to euraocean.fam, which has family and individual IDs line by line. I don’t know how to use spreadsheets in anything but a primitive way, so I assume there are ways to merge the files and get each line to have ancestry proportions as well as more detailed IDs. Generating mean values for populations also seems essential.
But I use R to do this dirty work.
#2 Visualizing the output with R
If you don’t have R, you need to install it. If you don’t know how to start, control-f sudo. That should yank it down for you. Once R is installed, make sure to be in the folder where you have ADMIXTURE. Then type “R” (no quotes when you type a command!). Now you are in R, what do you do? Here are the specifics of what you need to do:
1) Take the Q file, pump it into a data frame
2) Take the master list, pump it into a data frame
3) Take the .fam file, pump it into a data frame
4) Mix & match
5) Calculate mean proportions, output populations, etc.
6) Visualize!
If you needed to know how to install R, you probably don’t know how to do this. When I first started playing around with ADMIXTURE output files I wrote a quick & dirty script. I barely remember what I am doing with this script now, as I don’t care about the details. But it is now at your service. Still, first you need to do one thing: use a master list which is formatted slightly differently from the one that you downloaded. Here is the revised master list
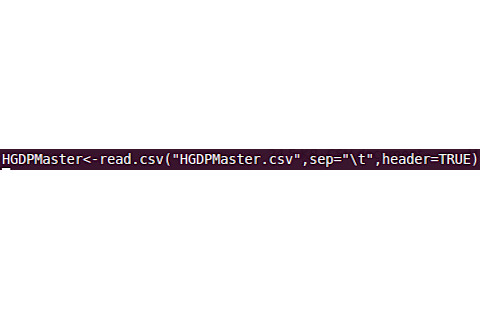
comand5
Put it in the same folder as ADMIXTURE. Then start R, again, by typing “R.” Run the command you see above. This creates an “HGDPMaster” data frame. That’s necessary for the script I’m giving you to run.
The script is here. If it doesn’t download, copy & paste, and create a file “Rstuff.R”, in the same folder as ADMIXTURE. There are a few variables which you have to manipulate. Here is the relevant section:
############### # change these ########### ### outputfiles fileName<-"euraocean" fileType<-"Q" #### sets the number of populations to through #lowest K Start_K<-12 #highest K End_K<-12
You need to change the file name to the one you have output. If you did do any manipulation, it should be ref.2.Q for K = 2, so the name is “ref.” You also need to put in the number of K’s. I often run many simultaneously, which I have output files for in the morning. So I often start with 2 and end with 12. If you just want to output one, for example, 2, change Start_K to 2, and End_K to 2. These are the only variables you need to change. But there is a lot more you could do. R “comments” with #, so there is a section which I commented out where you can limit the output to particular populations to make the bar plot less busy. You’ll see what I mean if you look at the script, just remove all the #’s, and reedit as to your taste. Please note that casing matters, so make sure to keep it lower case when possible (if you looked at the master list, you understand). The script does have a string to upper case function, but that’s only for the output. There’s also a small section where you can reedit the names to your taste.
To run the script, do like so:
source("Rstuff.R")
It should output out bar plots, as well as generating some spreadsheet files. There’s a lot more you can do…but if you can do a lot more, you wouldn’t be reading this post. Let’s move to the next issue. So now you wonder: is there any way I can change the data file, or add myself to it? Read on….
#3 Using Plink to manipulate the data file
Now you need Plink. I usually put it within the same larger folder as a subfolder parallel with ADMIXTURE. You run the Plink command like so: “./plink” or, “plink.” Depends on the environment (remember, the quotes are only for the post!). There are many things you can do with Plink. I will show you how to do two things.
#1 remove individuals from the data set
#2 add yourself (or someone whose 23andMe file you have) to the data set
#1 is important because the plots get busy with too much variance. Additionally, Africans, and genetic isolates which have gone through population bottlenecks, tend to overwhelm ADMIXTURE. You probably want to remove them. To do this you need to use the remove option. You need to remove individuals.
Here’s one option with the file you’ve got:
./plink --bfile ref --remove removelist.txt --make-bed --out refRemoved
What’s going on above? You’re using a binary pedigree file, so you have the –bfile option on. You do the deed with –remove, and then you create a second binary pedigree file, refRemoved. So you’ll have refRemoved.bed, refRemoved.bim, and refRemoved.fam. Obviously removelist.txt has what you want to remove. Each line has a family ID and individual ID, separated by a space, of those who you want to remove. The easiest way is probably to open up the master list. For the one I gave you above the last column is the family ID and the first is the individual ID. Cut & paste the first column after the last, delete the other columns, and save. I usually get rid of quotations and tabs, change it to a .txt file, and there you have it.
But what about your 23andMe file? You need to convert it to pedigree. I have created a quick & dirty perl script to do so. You can find it here. Download or cut & paste it. You need to remove the comments at the top of the 23andMe file. That is, you need to remove everything before the first SNP. Assuming that’s done, do this at the command line within the folder where you put the script (you get to that folder with “cd” recall):
perl convert.pl "YourFileName" "001" "001"
The script fires, gets the file name from the first parameter, and outputs two files, YourFileName.ped and YourFileName.map. What about the two other parameters? They’re generating your family ID and individual ID. They’d be FAM001 and ID001 in this case. You need to enter these into the master list! Otherwise you won’t come out on the bar plots. Also enter your ethnicity, etc. Or, just your name if you want to be your own slice of the bar plot.
Note that you have .ped, not .bed, files. These are big. Now you need to convert the text to binary pedigree. Move the YourName files to the plink folder. Make binary:
./plink --file YourFileName --make-bed --out YourFileName
Now you have YourFileName.bed YourFileName.bim YourFileName.fam. It is best to limit your SNPs to the same as those in the reference data set. So get those from the reference:
./plink --bfile ref --write-snplist --out SNPs
You should have a file, SNPs.snplist. Use them to filter your 23andMe file.
./plink --bfile YourFileName --extract SNPs.snplist --make-bed --out YourFileNameFiltered
Now you want to merge:
./plink --bfile ref --bmerge YourFileNameFiltered.bed YourFileNameFiltered.bim YourFileNameFiltered.fam --make-bed --out ref
You are now appended to the reference data set! If you open up the ref.fam file your family ID and individaul ID should be at the end of the list.
If you’ve slogged through this far, I thought it would be nice to end with something which shows what this is all about. Below I’ve filtered the reference data set of most African and New World populations, and run it from K = 2 to K = 12. It took about ~10 hours to complete. I’ve also limited the populations to display using the script above so that it isn’t too clustered. Here are the spreadsheets generated from the runs (they will be in folder where you run the R script, and have the form “K =2” and such for names).


