From Antarctica to Greenland to the Himalayas, study after study in 2019 reported the world’s ice is melting at an accelerated rate. New scientific innovations allowed researchers to better quantify mass ice losses, and their studies exposed startling trends. The new findings paint a troubling future for glaciers around the world: If current ice-loss rates continue, scientists predict the collapse of glaciers around the world before the end of the century.
Wet Paws
Sled dogs wade through a melting ice sheet in Greenland as researchers from the Danish Meteorological Institute travel to retrieve equipment in June. Three months earlier, a team of scientists in Denmark, the U.K. and the U.S. had published a study in Science Advances, predicting that over 25 percent of global sea level rise is due to the Greenland Ice Sheet melting; and Greenland alone could contribute 13 inches to sea level rise by the end of the century. Without substantial reductions in greenhouse gas emissions, the researchers project, the island’s ice will disappear entirely before the end of the millennium.
Death of a Glacier
What’s left of the first Icelandic glacier lost to climate change, pictured above in 2018, was commemorated in 2019 with a memorial plaque. Glaciologist Oddur Sigurðsson declared Okjökull a glacier-no-more back in 2014, when the ice became too thin for glacial movement. But it wasn’t until 2019 that members of the Icelandic Hiking Society, Rice University and the general public installed the monument at its former site. The August induction of the memorial followed the publication of an April Nature study that attributes 25 to 30 percent of the observed global mean sea level rise between 1993 and mid-2014 to glacier melting.
Plaque installed in August 2019 at the site of former glacier Okjökull. It reads:
A letter to the future
Ok is the first Icelandic glacier to lose its status as a glacier. In the next 200 years all our glaciers are expected to follow the same path. This monument is to acknowledge that we know what is happening and what needs to be done. Only you know if we did it.
August 2019
415 ppm CO2
Spy Satellites
Recently declassified images taken by U.S. Cold War spy satellites have proved surprisingly helpful to glaciologists. Photos like the one to the left, from the border of India and Nepal in December 1975, are a snapshot of the past extent of the Himalayan glaciers. In a June study in Science Advances, researchers used the multi-angle observations of these spy films to build a 3D model of the region in the last quarter of the 20th century. Their analysis shows that the Himalayas have lost twice as much ice in the last two decades as they did between 1975 and 2000.
Ice, Ice, Melty
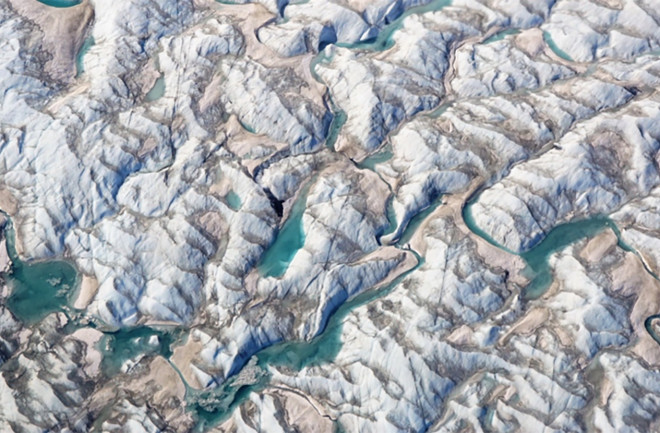
Melt season came early this year to Greenland’s Russell Glacier, researchers working on NASA’s Operation IceBridge noticed in May. And new research suggests that could become a common occurrence across Greenland. Normally, snow covers and protects most of a massive ice sheet from the heat of the sun. But the snow ends at what’s called the snowline, leaving the bare ice exposed. A March Science Advances study pointed to changes in Greenland’s snowline as a factor accelerating ice loss in the region. Greenland’s snowline moved about 55 feet per year from 2001 to 2012, exposing more ice to the sun’s melting rays.
Movin’ on Ice
Ice is always on the move. Knowing where — and how fast — it’s going is crucial for predicting ice sheet stability, which informs predictions about melt rates and sea level rise. That’s why researchers in California have created the most precise map so far of Antarctica’s ice velocity, which they published in Geophysical Research Letters in July. But that wasn’t the only Antarctic news in 2019. In a January study in the Proceedings of the National Academy of Sciences, a different team found that the melting continent has contributed more than half an inch to global sea levels in the past 40 years, and it’s now losing six times more ice annually than it did in 1979.
Over/Under
Ice sheets like LeConte Glacier in Alaska (left) don’t just melt on their open-air surfaces; they can also lose ice underwater. In a July Science paper, a group of researchers used a multibeam sonar system — the same technology anglers use to find large schools of fish in the ocean — to directly measure underwater melting rates for the first time. The innovative approach shows LeConte could be melting 100 times faster than previously estimated by theoretical models, suggesting worldwide melt rates may be seriously underestimated.
[This story originally appeared in print as "A Melting Planet."]


