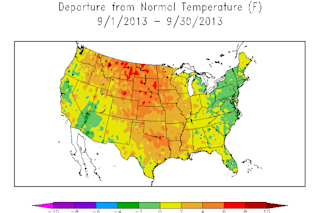
Source: National Climatic Data Center Carbon emissions in the United States may be down, as announced by the Energy Information Administration yesterday, but temperatures are still running high. Last month was the sixth warmest September in the United States, in a record stretching back 119 years. The map above, from the National Climatic Data Center, shows how temperatures departed from the long-term average. (You can create your own maps at NCDC here.) Here's how precipitation shaped up in September:
Source: National Climatic Data Center Thanks to precipitation that in large parts of the West exceeded 200 percent of normal, September ranked as the 12th wettest on record, according to the NCDC. The Front Range of Colorado made it's own special contribution. Look closely at Colorado on the map and you can see a pinprick of magenta color showing an area centered on Boulder where rainfall exceeded 800 percent of average. ...


