We have completed maintenance on DiscoverMagazine.com and action may be required on your account. Learn More

Meltdown: On the Front Lines of Climate Change

After watching over Earth’s poles for decades, NASA aviators see new warnings of the chaos to come.

By Eric Betz
May 19, 2017 12:00 AMNov 21, 2019 7:41 PM
DC-8 over Antarctica - Harbeck
A NASA research plane, the DC-8, flies over the Antarctic Peninsula’s northern tip. The aircraft is retrofitted to take measurements of land and sea ice. (Credit: Jeremy Harbeck)

Newsletter

Sign up for our email newsletter for the latest science news
 

“Terrain! Terrain! Pull up!”

The programmed alarm rings throughout the plane’s cockpit, announcing a fast-approaching rocky outcrop. Pilot David Fedors casually reaches out a hand and overrides the warning. Twisting the altitude knob to the left, he aims the plane down toward an endless expanse of white, gleaming in the midday sun. He levels it off at a cruising altitude of 1,500 feet.

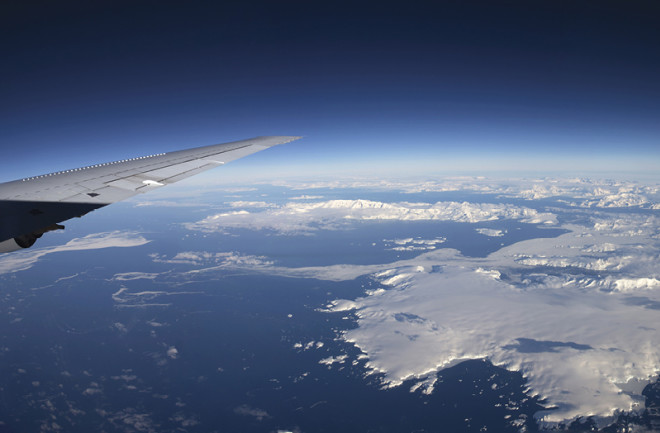
NASA’s Airborne Laboratory is flying low over the West Antarctic Ice Sheet. Inside, a team of scientists is taking the temperature of a continent blanketed in 5 million square miles of ice, equivalent to about 60 percent of the planet’s freshwater.

Their instruments are zeroed in on the Amundsen Sea Embayment, a vast region rich in volcanoes, ice shelves and glaciers, some as big as Washington state. Here and across Antarctica, eons of storms have piled snow, inch by inch, layer by layer, until the ice was miles high. Glaciers deliver that ice from the inner reaches of the continent to the ocean, where massive frozen shelves float atop the water.

NASA’s crew members navigate the dicey weather and terrain at Earth’s poles. (Credit: Mario Tama/Getty Images)

In the belly of the plane, an array of instruments stares at the ice through a window cut into the nearly 50-year-old DC-8’s former baggage compartment. Radar signals pass through each ice layer, gauging its depth. Infrared waves measure heat. Laser pulses calculate the surface height. And a gravimeter picks up tiny changes in Earth’s gravitational field, perfectly mapping the seafloor’s rocky bottom.

These tools reveal what’s invisible to the eye. Warm ocean water is washing up and melting the ice from below. Decades of data from the Amundsen Sea Embayment show glaciers are disappearing faster here than anywhere else on Earth. And now, new insights into the terrain suggest the melt is unstoppable. These coastal glaciers hold back inland glaciers, so their collapse would set off a chain reaction ending with the West Antarctic Ice Sheet pouring into the Southern Ocean. That could mean 10 feet of sea level rise. Coastal cities would flood worldwide. But when? This question is the new frontier of climate research.

Geoscientist David Gallaher works in the DC-8’s former baggage compartment, now fitted with instruments that collect data such as glacial thickness and changes in Earth’s gravitational field. (Credit: Mario Tama/Getty Images)

“The big challenge of the future is to figure out these timescales,” says Eric Rignot, a glaciologist and professor at the University of California, Irvine. “It may go fast. It may go slow.”

Scientists are probing these glaciers from land, air, sea and satellite. And they’re plugging that data into cutting-edge computer models. The answers they find — and humanity’s response — could forecast the planet’s future for millennia.

Mission to Earth

Scientists knew more than a century ago that adding carbon dioxide to our atmosphere would warm temperatures. Yet it was partly observations of another planet altogether that helped launch the effort to understand what was happening on Earth. The first explorations of Venus showed how greenhouse gases trap heat and stifle a planet. James Hansen, now one of the world’s most recognized climate scientists, was spearheading NASA’s Pioneer mission to Venus in the late 1970s. Astronomers were learning that atmospheric carbon dioxide levels hundreds of times greater than Earth’s made our nearest neighbor boiling hot at its surface.

Venus helped call Hansen’s attention to the climate problems at home. So he resigned his post and set about reworking a sophisticated weather model into a long-term climate projection. Then, Hansen and his colleagues asked the model a simple question: How would Earth respond if carbon dioxide emissions double? The journal Science published the alarming answer in 1981: Regional droughts. Sea level rise. Global warming. Other scientists were reaching similar conclusions.

Warm ocean water circulates under ice shelves, melting the glacier’s underbelly and pushing the grounding line, where ice meets rock, farther inland. This destabilizes the glacier and quickens its retreat. (Credit: Jay Smith after National Snow and Ice Data Center)

“The details have been filled in much better,” Hansen says, “but that 1981 paper had an outline of the problem that we now have thousands of scientists struggling on.”

Amid the fresh scientific questions emerging on Earth — and sweeping budget cuts for space exploration — Congress in 1984 gave NASA a new mandate: increase “human knowledge of the Earth.” By the early 1990s, the space agency was laying the groundwork for what would become the Earth Observing System, its main climate science contribution.

Eventually the space agency deployed a team of scientists and crack flyers, some of them NASA test pilots, to Greenland. They circumnavigated harsh weather and unforgiving terrain until they found the first proof for vanishing ice sheets.

Jim Yungel was an early recruit to this “Mission to Planet Earth.” With the threat that a warmer world would melt glaciers, NASA wanted his group to measure the ocean’s height and track sea level rise. “That’s very difficult to do,” Yungel says. Tides, waves, even large ships make it nearly impossible to detect changes.

Operation IceBridge launches from its home base in Chile. Pilots refer to the crisscrossing flights above West Antarctica to take measurements as “mowing the lawn.” (Credit: NASA/Goddard Space Flight Center Scientific Visualization Studio)

So they’d map Greenland instead. At the time, scientists had hints from satellites, but they weren’t sure if the world’s major ice sheets were melting. GPS was in its infancy. The plan was for NASA pilots to crisscross the continent in jets loaded with new technology that promised precision measurements unlike any made before. “For decades, glaciologists had sort of been toiling in obscurity with small-scale tools,” says NASA’s John Sonntag, a veteran of those early flights and still part of the team.

Test runs over Greenland in the early 1990s showed that the upstart team could measure ice sheet height to within just a few inches. By 1993 and 1994, they were flying scientific grids over the glaciers. “We didn’t know what changes we were looking for, but we thought they’d be pretty small,” Sonntag says. So when the team returned to their flight paths five years later, they were surprised at how fast the coastal glaciers had melted. Greenland was losing 12 cubic miles of ice each year. Their research, published in Science in 2000, was the first to measure the shrinking of a major ice sheet. It wouldn’t be the last.

Earth’s ocean currents, shown in this NASA animation, cycle warmer water from the equator toward far-flung regions. (Credit: NASA/Goddard Space Flight Center Scientific Visualization Studio)

Turn Up the Heat

At its core, Earth’s climate system is actually quite simple. Sunlight is most intense in the tropics along the planet’s equator. And physics is constantly trying to push heat from the tropics toward the poles, where it can radiate back to space.

“All the atmospheric circulations that occur, and all the ocean circulations that occur, are basically doing that — they’re transporting heat,” says veteran climatologist Gerald Meehl of the National Center for Atmospheric Research. For example, the Gulf Stream moves heat into the North Atlantic, bringing Europe a pleasant climate, and then it radiates the heat out into space. The poles also have their own currents.

Antarctica’s strong Circumpolar Deep Current circles the entire continent, driven by strong winds called westerlies, which also create the Southern Ocean’s dangerous and choppy waters. Incoming currents drive warm water up from the bottom. In some places, like the Amundsen Sea, the warm water even reaches the continental shelf. And this water is getting warmer.

“All we know so far is that currents are changing. And the waters where those currents come from, those waters are getting warmer,” says Alek Petty, a climatologist on the Operation IceBridge team. “That makes sense with our general ideas of what happens during global warming, but the actual mechanisms are still uncertain.”

Trouble Below

Unlike in Greenland, it’s typically too cold for ice to melt on Antarctica’s surface. But temperature measurements taken off the continent’s coast found warm water brewing up from the ocean depths. By 1998, satellites revealed that Pine Island Glacier in the Amundsen Sea Embayment was retreating. In the past, experts thought the undersides of glaciers would melt only a few inches each year. This glacier was losing more than 150 feet annually. Pine Island and its neighbor glacier Thwaites both act like a stopper for the West Antarctic Ice Sheet. Scientists worry that their melting might unleash inland floes that would also flood into the sea. “The basic concept is that if these glaciers are going down, the rest of West Antarctica is going down as well,” says Rignot.

In 2002, the NASA team headed south to help with the Antarctic efforts. They hoped to fly 12-hour round trips from the southern tip of South America to the remote reaches of Antarctica. But there were no reliable weather forecasts back then. If they encountered any significant problems, they’d be stuck there — or worse. “It’s very cold, and a long way from any help,” Sonntag says.

NASA’s most recent workhorse for Operation IceBridge has been a DC-8 jet airliner, a model that went out of production in the early 1970s. Here, technicians prepare the plane for a flight to Antarctica from an airport in Punta Arenas, Chile. (Credit: Jeremy Harbeck)

“I remember the first flight that we were on,” Rignot recalls. “When we went out there, the winds were actually the opposite [of predictions], and they slowed us down.” It looked like the plane would reach Antarctica and have just enough fuel to fly straight back without collecting any data, proving their mission was truly impossible. “Midway through, the winds changed direction and pushed us through to the Antarctic,” he says. “We gained back everything we had lost.”

Perfect blue skies greeted them. And as they descended toward Pine Island Glacier, 23 excited scientists and technicians crammed into the cockpit to take pictures. “That was an awesome moment,” Rignot says. “We needed measurements from an airplane to measure the thickness of the ice. We can’t do that from space.”

The team’s findings added to glaciologists’ worst fears for the Amundsen Sea Embayment.

Scientists worry about West Antarctica because the ground under its ice sheet sits below sea level. This means that as glaciers recede, warm water quickly rushes in to melt more ice. (Credit: British Antarctic Survey)

Weak Underbelly

It’s tough to tell Earth from sky. As we fly 1,500 feet over West Antarctica, a thin layer of puffy clouds surrounds the aircraft, casting cloud shadows across miles of ice. The team’s work environment inside the carved-out DC-8 is far less picturesque. Faded blue upholstery peels around the cockpit windows; the cabin smells like aging vinyl; and computer cables dangle from the overhead compartments. NASA’s legacy of airborne climate research lives on in these humble surroundings.

Former Air Force aviators and NASA test pilots fly state-of-the-art scientific instruments up and down the ice sheets on a mission called Operation IceBridge. And this bridge of data is essential: NASA’s polar-observing satellite ICESat died in 2009, and the much-delayed launch of ICESat-2 isn’t expected until next year.

The aircraft breaks free of the clouds, and a plane-shaped shadow slides across the ice sheet between crevasses more than 100 feet deep. Flying past Pine Island Bay takes the plane over a glacial graveyard. This is where Pine Island and Thwaites meet the sea. Massive ice shelves — Antarctica’s largest is bigger than California — get shoved off and float atop the ocean.

The boundary between glacier and ice shelf is called a grounding line. This is “where ice detaches from the ground and starts floating,” says Bernd Scheuchl, a UC Irvine climatologist who’s mapped ice movements across the continent. “It’s the boundary between grounded ice and floating ice.”

Much of the bottom melt can be blamed on unfortunate topography. East Antarctica’s ice sheet hides a mountain range that rivals the Alps. West Antarctica, though, is a different story. Its mile-high glaciers rest on ground that’s largely below sea level. Scientists refer to this sunken expanse as the continent’s weak underbelly. Scrape off the glaciers, and water will rush in, with just a few islands poking above the ocean surface.

A series of deep crevasses form as Pine Island Glacier slowly slides toward the sea. (Credit: Jeremy Harbeck)

As warm ocean water erodes the bottom of the ice shelf, the grounding line retreats inland. Natural underwater ridges and hills help stabilize a retreating glacier. They act like a brick behind a car tire, stopping a downhill roll. But recent surveys indicate there are hardly any stable ridgelines left to stop the glacial retreat.

Unstoppable Retreat

Over the past 15 years, NASA’s airborne team has flown hundreds of zigzag patterns across Pine Island, Thwaites and their neighboring glaciers: Pope, Smith, Haynes and Kohler. Pilots call the crisscrossing flights “mowing the lawn.”

Their collected data has allowed Rignot, Scheuchl and their team at UC Irvine to map the seafloor in the region. Satellite data also helped them make a detailed map of grounding lines across Antarctica and determine where glaciers were retreating fastest. “The ocean bed is quite complex, and there are some regions that provide access for warm, deep ocean water to those glaciers,” Scheuchl says.

These detailed maps of the landmass under the glaciers show that the retreat can’t be stopped. Pine Island, Thwaites and some of their neighbors have used up their stable grounding lines and are retreating miles inland. “There’s no big bump inland that could potentially slow down or stop the retreat of these glaciers,” Rignot says. “If the ocean gets warmer and warmer, it’s going to get faster and faster.”

Icebergs calve from Thwaites Glacier and float on Pine Island Bay. (Credit: Jeremy Harbeck)

The high-resolution maps have also helped explain how the warm water reaches the undersides of glaciers in the Amundsen Sea Embayment. In a study published in Geophysical Research Letters in February, the UC Irvine team used Operation IceBridge data to spot deep channels under the floating ice shelves. Carved by growing glaciers during colder times, these seafloor valleys extend thousands of feet below Pine Island and Thwaites. Other channels reach perhaps more than 5,000 feet deep under the Dotson and Crosson ice shelves, which sit at the mouth of Smith, Pope and Kohler glaciers.

The ice loss is already enough for satellites to detect changes in Earth’s gravity field. As the weight of ice sheds and melts into the ocean, the gravity field in the area changes slightly. The European Space Agency’s CryoSat mission shows that the continent’s volume dropped by 30 cubic miles each year from 2011 to 2014. That data backs up observations from NASA and ESA satellites confirming that the loss was most extreme in the Amundsen Sea region.

Thwaites Invasion

The recent data have stoked fears that Thwaites might pose the biggest threat. Because of the changes already underway here, Thwaites’ melting rate doubled in just six years, and it now generates some 10 percent of global sea level rise. The glacier’s total collapse could push sea levels 2 feet higher.

Brooke Medley, who was on the flight, studies ice sheets at NASA’s Goddard Space Flight Center in Maryland. As the glacier passes by outside the airplane window, she notes that Thwaites could take perhaps 200 years or more to collapse. Already, it’s responsible for half the water being added to the ocean along the Amundsen Coast.

An Operation IceBridge plane lands at Greenland’s Thule Air Base. In the 1990s, data collected on flights showed dramatic glacial melt. (Credit: NASA)

“We don’t know how much the ice sheet beneath it is going to melt,” she says. But her team found grim results when they tried to model what might happen. “No matter what scenario we threw at it, Thwaites collapsed,” Medley says.  Scientists aren’t sure how long that will take, and the uncertainty has turned new attention to Thwaites. A deep, narrow trough helps constrain Pine Island Glacier. Thwaites isn’t so lucky. The glacier will widen as it retreats deeper inland. Medley says this geometry means Thwaites will also start to draw more stable ice from neighboring glaciers.  A $25 million expedition next year, funded by the National Science Foundation and the United Kingdom’s Natural Environment Research Council, will collect data on Thwaites that might offer a better expiration date. The field excursion, which scientists are calling “Thwaites invasion,” won’t be easy. The glacier is one of the most hostile places in Antarctica.  Rignot says Operation IceBridge has given his team the data they need to start computing high-resolution models. Their next step is to harness some significant computer power — and pair it with better observations of ocean heat — to try and more precisely forecast sea level rise. “We’ve sort of mapped the heck out of this sector,” Rignot says. “We’ve reached the point now where we have some really nice datasets for the models to run.”  The research from West Antarctica has already prompted the U.S. government to revise its predictions for sea level rise by 2100. A January report by the National Oceanic and Atmospheric Administration reviewed the latest observations from Antarctica and Greenland. It estimated that oceans could rise by 8 feet this century under the worst-case scenario. Their optimistic case: 1 foot. Rignot says the team’s goal isn’t to watch ice sheets collapse. It is to collect evidence so policymakers will listen and take action, even if there’s no way to stop the inevitable.  “We can have an effect on the speed of the retreat of these glaciers,” he says. “If the retreat were to proceed on timescales of 1,000 years instead of a century, it would make a big difference. 


Read more about Larsen's Meltdown.


Eric Betz is an associate editor at Discover. He’s on Twitter: @ericbetz

[This article originally appeared in print as "Meltdown"]

1 free article left
Want More? Get unlimited access for as low as $1.99/month

Already a subscriber?

Register or Log In

1 free articleSubscribe
Discover Magazine Logo
Want more?

Keep reading for as low as $1.99!

Subscribe

Already a subscriber?

Register or Log In

More From Discover
Recommendations From Our Store
Shop Now
Stay Curious
Join
Our List

Sign up for our weekly science updates.

 
Subscribe
To The Magazine

Save up to 40% off the cover price when you subscribe to Discover magazine.

Copyright © 2024 Kalmbach Media Co.