"It's the economy, stupid."
That was the phrase coined by political strategist James Carville to help the 1992 presidential campaign of Bill Clinton — who went on to defeat President George H.W. Bush. And it encapsulates the idea that how voters are thinking about the economy often is the most important factor in deciding a presidential election.
If recent polling can be trusted, that sure seems to be the case this time. In a recent Gallup survey, for example, the economy was ranked as the most important of 22 issues U.S. registered voters said would influence their choice for president. "It is the only issue on which a majority of voters, 52 percent, say the candidates’ positions . . . are an 'extremely important' influence on their vote," according to Gallup.
Meanwhile, climate change was next to last on the list of concerns (just above transgender rights).
This makes sense. We all have to pony up regularly for housing, groceries, transportation, healthcare, etc. Meanwhile, unless your home is burning down in a wildfire, climate change may well seem less immediate. The issue seems to be about the future of things that might impact us, as opposed to, "What can I put on the dinner table tonight without breaking the bank?"
If you do feel that way, you might want to consider two graphs, which together show that doubling down on the transition to clean, climate-friendly energy can strengthen the economy, not weaken it.
A Tale of Two Graphs
I'll start with the graph related to climate change, and then follow with a second one showing that doing something about climate change is already helping us put things on the table without breaking the bank.
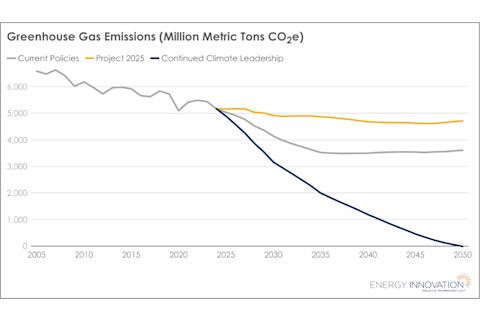
Based on computer modeling, this graph depicts three scenarios for U.S. emissions of climate-altering greenhouse gases. The gray line shows a prediction of the emissions trend with continuation of current policies, including those enacted during the Biden Administration. The blue line shows what would happen with further action focused on getting us to net-zero emissions by 2050. And the orange line shows an estimate of emissions under the provisions outlined in Project 2025, a policy blueprint for a Republican president and Congress prepared by the conservative Heritage Foundation. (Credit: Energy Innovation Policy & Technology)
Energy Innovation Policy & Technology
This graph focuses on emissions of carbon dioxide and other greenhouse gases that are warming the planet and worsening a host of climate impacts, including heat waves, droughts, wildfires, and extreme precipitation. It's based on modeling by Energy Innovation Policy & Technology, a non-partisan think tank, and it is included in a comprehensive report by researchers affiliated with the organization.
The gray line shows the impact of policies enacted under the Biden Administration, including the Inflation Reduction Act, the Bipartisan Infrastructure Law, the CHIPS and Science Act, and new Environmental Protection Agency rules. The trajectory of the line shows a doubling of the rate of emissions reductions from what we were experiencing before. This is putting the United States in a better position to achieve its goal of cutting emissions at least 50 percent from 2005 levels by 2030, according to the report.
But more is needed to get to that goal, and eventually to net-zero emissions by 2050. The blue line in the graph above shows what that trajectory would look like.
Now, let's talk about the orange line. It represents the emissions trajectory, as estimated by the model, if the energy provisions of Project 2025 — the nearly 900-page policy blueprint produced by the conservative Heritage Foundation — were enacted by a new Republican administration and Congress.
Interestingly, emissions continue to decline just a little, at least for awhile. That's because policy and economics now favor continued improvements in energy efficiency, and the ongoing transition away from dirty fossil fuels to renewable sources of energy. We're already on the road toward a new energy economy, but under Project 2025, progress would ultimately all but stall. That would mean a much warmer world and more severe climate impacts.
As an aside, it's true that Donald Trump has sought to distance himself from Project 2025 and has said he doesn't even know who is behind it. But an investigation found that at least 140 people who worked for him were involved in producing the policy blueprint. So in all likelihood, the document will significantly influence a new Trump administration, should he win the election.
But even setting aside Project 2025, former President Trump has been clear about what he thinks, calling climate change “one of the greatest scams of all time.” During his first-term, he yanked the United States out of the Paris climate agreement and rolled back more than 100 environmental regulations. In a second term, he's promising to go further by blocking U.S. involvement in future global climate agreements, and ending federal support for the clean energy transition, while jacking up oil and gas drilling.
So, there's little doubt about what will happen to U.S. carbon emissions under a Trump administration and a Republican-controlled Congress.
But once again, "it's the economic, stupid," right? And yes! It absolutely is!
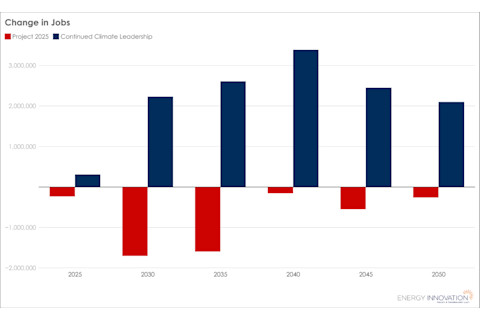
Compared to continued U.S. leadership on reducing carbon emissions, Project 2025 would lead to significantly reduced job growth. (Credit: Energy Innovation Policy & Technology)
Energy Innovation Policy & Technology
The Energy Innovation researchers also modeled how continuing to invest in clean energy technologies, upgrading buildings, and retooling industries, versus ramping up production of fossil fuels, would affect job creation. The blue and red bars in the graph above tell the tale.
Here are the numbers behind the blue bars: This climate leadership scenario would add 2.2 million jobs in 2030, and 2.1 million in 2050. Meanwhile, under the Project 2025 scenario, job gains do occur in the fossil fuel industry, "but they are more than offset by job losses elsewhere in the economy," according to the report. "The Project 2025 scenario leads to 1.7 million lost jobs in 2030 and 260,000 lost jobs in 2050."
But what about inflation? Won't reemphasizing fossil fuels save American households money?
Not so, according to the analysis. Doubling down on U.S. climate leadership would lead to lower household energy costs over the long run — because renewables already are outcompeting fossil fuels. A report last year, also from the Energy Innovation think tank, found that 99 percent of existing U.S. coal power plants were more expensive to run compared to new solar or wind installations.
So, here's the bottom line: You don't have to choose between prioritizing a strong economy and combatting climate change. If the United States chooses to remain at the forefront of the transition away from fossil fuels to renewable energy, we will reduce the risks we face from climate change while also helping to create a strong economy that's the envy of the world.


