This year we give thanks for a concept that has been particularly useful in recent times: the error bar.
Error Bar

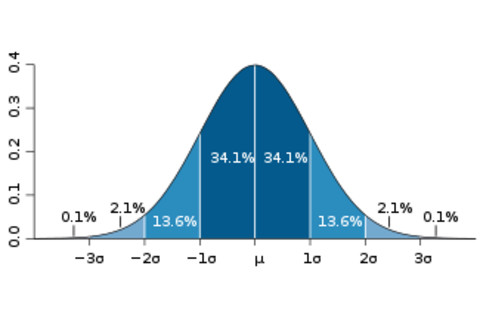
Error bars are a simple and convenient way to characterize the expected uncertainty in a measurement or for that matter the expected accuracy of a prediction. In a wide variety of circumstances (though certainly not always), we can characterize uncertainties by a normal distribution -- the bell curve made famous by Gauss.
Standard Deviation
Sometimes the measurements are a little bigger than the true value, sometimes they're a little smaller. The nice thing about a normal distribution is that it is fully specified by just two numbers -- the central value, which tells you where it peaks, and the standard deviation, which tells you how wide it is.
The simplest way of thinking about an error bar is as our best guess at the standard deviation of what the underlying distribution of our measurement would be if everything were going right. Things might go wrong, of course, and your neutrinos might arrive early; but that's not the error bar's fault.
Standard Error
Now, there's much more going on beneath the hood, as any scientist (or statistician!) worth their salt would be happy to explain. Sometimes the underlying distribution is not expected to be normal. Sometimes there are systematic errors. Are you sure you want the standard deviation, or perhaps the standard error? What are the error bars on your error bars?
While these are important issues, we're in a holiday mood and aren't trying to be so picky. What we're celebrating is not the concept of statistical uncertainty, but the elegant shortcut provided by the concept of the error bar. Sure, many things can be going on, and ultimately we want to be more careful; nevertheless, there's no question that the ability to sum up our rough degree of precision in a single number is enormously useful. That's the genius of the error bar: it lets you decide at a glance whether a result is possibly worth believing or not.
Cosmic Microwave Background
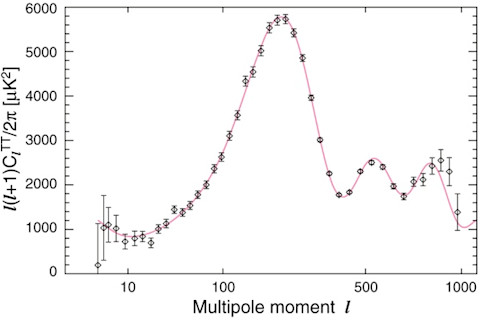
The power spectrum of the cosmic microwave background is a pretty plot, but it only becomes convincing when we see the error bars. Then you have a right to go, "Aha, I see three peaks there!"

Sigma
And the error bar isn't just pretty, it provides some quantitative oomph. An error bar is basically the standard deviation -- "sigma," as the scientists like to call it. So if your distribution really is normal you know that an individual measurement should be within one sigma of the expected value about 68% of the time; within two sigma 95% of the time, and within three sigma 99.7% of the time. So if you're not within three sigma, you begin to think your expectation was wrong -- something fishy is going on. (Like maybe a Nobel-prize-worthy discovery?)
Once you're out at five sigma, you're outside the 99.9999% range -- in normal human experience, that's pretty unlikely. Error bars aren't the last word on statistical significance, they're the first word. But we can all be thankful that so much meaning can be compressed into one little quantity.


