Photo: flickr/Kevin Cortopassi
Are humans that different from gas particles? Not according to these physicists. They carefully studied online videos of mosh pits at heavy metal concerts, measured the motions of each participant, and then determined how well their data fit simplified models of particle physics. Amazingly, the best fit for mosh pits was to the Maxwell–Boltzmann distribution, which "describes particle speeds in gases, where the particles move freely without interacting with one another, except for very brief elastic collisions in which they may exchange momentum and kinetic energy, but do not change their respective states of intramolecular excitation" Sounds like a mosh pit to me!
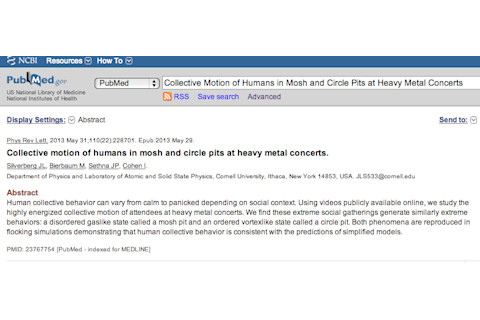
Collective Motion of Humans in Mosh and Circle Pits at Heavy Metal Concerts "Human collective behavior can vary from calm to panicked depending on social context. Using videos publicly available online, we study the highly energized collective motion of attendees at heavy metal concerts. We find these extreme social gatherings generate similarly extreme behaviors: a disordered gaslike state called a mosh pit and an ordered vortexlike state called a circle pit. Both phenomena are reproduced in flocking simulations demonstrating that human collective behavior is consistent with the predictions of simplified models." Bonus figure from the main text:
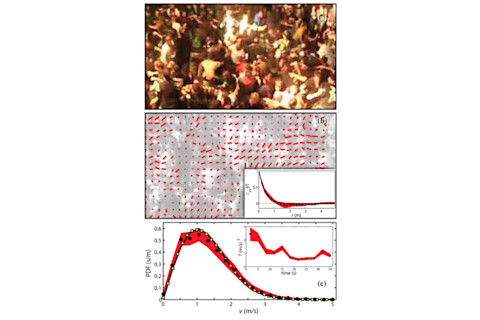
FIG. 2 (color online). (a) Single video frame illustrating a characteristic mosh pit [8]. (b) The same video image with overlaid velocity field. To facilitate comparisons with (a), this image is not corrected for perspective distortions. Inset shows the measured velocity-velocity correlation cvv (solid black circles) as a function of distance r, as well as the best fit to a pure exponential (black line, R2 1⁄4 0:97). (c) The measured PDF for speed from the same video (solid black circles), the best fit to a 2D Maxwell-Boltzmann distribution (black line), and the speed distribution found in simulations (yellow squares). Inset shows the best-fit temperature as a function of time illustrating that an initially ‘‘hot’’ mosh pit ‘‘cools down.’’ Error estimates are in red for all plots.
Thanks to Thomas for the tip! Related content: NCBI ROFL: Head and neck injury risks in heavy metal: head bangers stuck between rock and a hard bass.


