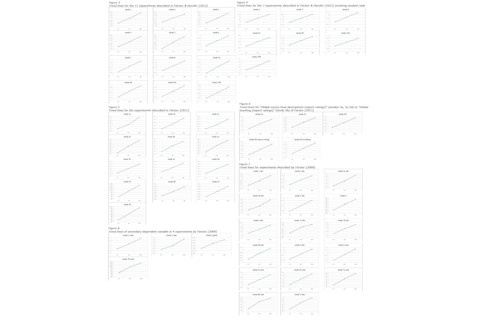
Three weeks ago I covered the story of Jens Förster, the German social psychologist who was accused of scientific misconduct after statisticians noted unusual patterns in his published data. More evidence has come to light since then, but there are still no clear answers as to what really happened. In this post, I examine the data and conclude that data fabrication - whoever is responsible for it - is the only plausible scenario. As I discussed last time, the accusations present very strong evidence that there is 'something' wrong with the reported data in three of Förster's papers. Specifically, that the data would be astronomically unlikely to occur, given the methods described in the papers, even under the most favorable assumptions. The odds would be 1 in 508,000,000,000,000,000,000. The problem is that the results of dozens of individual experiments are too linear. For my overview of what this 'superlinearity' issue means, see this post (and be sure to check out the excellent comments.) Uri Simonsohn's Data Colada blog offers an excellent and clear look at the issue. Here's a graphic illustration:

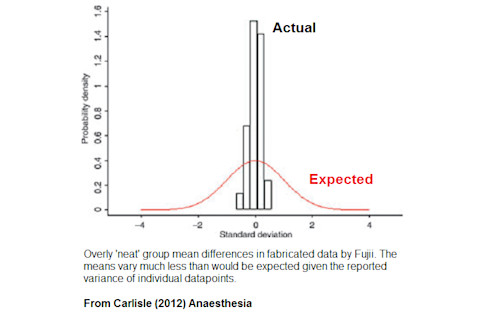
So the null hypothesis, that the data are correctly reported and came from the methods as described, can be rejected. But this doesn't necessarily indicate misconduct. Can we know what really happened? I've been mulling over this issue for the past couple of weeks. As I see it, there is only one plausible explanation. But to get to that conclusion I'm going to run through some other suggestions - starting with the most benign. Possibility #1 - Wrong Accusation Could it be that Förster's data and conclusions are all 100% accurate, and the 'superlinearity test' only says otherwise because that test is flawed? I originally thought so. I was concerned by the fact that Förster's data are categorical while the superlinearity test assumes continuous data. But then a full inquiry report was published, revealing an important fact: that when Förster's data are broken down into male and female subgroups, neither group showed superlinearity. Only the combined group of both sexes did. If superlinearity were an artifact of the data's properties, it would affect subgroups as well. I'm unaware of any other possible reasons to doubt the superlinearity test. Förster has never suggested any. Although he has claimed that'many experts have raised concerns' about the test, he has never detailed any specific flaws. Possibility #2 - Honest Mistake Could the superlinearity be a result of honest error? I thought up one scenario in which this could happen. Suppose Förster, when reporting the group standard deviations in his papers, was mistaken about which value to use and ended up quoting the group variances, mislabeled as 'standard deviations'. Since variance is standard deviation squared, this would mean that the true standard deviations would be smaller than reported in the papers. This would, in turn, make the superlinearity test biased towards detecting superlinearity. However, while this is an elegant explanation, this report says that an independent expert checked the data and declared that the statistics Förster had used were all correct - so it's ruled out. I have failed to think of any other honest mistake that would consistently produce superlinearity. Superlinearity is quite a difficult property to introduce into a dataset. The problem is that introducing it requires non-independence across datapoints. Whether one datapoint changes up or down has to depend causally upon the values of the other points, implying a fairly complex process. I struggle to think of a 'silly mistake', like a copy-paste mistake or a spreadsheet error, that would do that. This Retraction Watch thread contains a few suggestions, but I don't find any of them convincing. Possibility #3 - Questionable Research Practices Questionable Research Practices (QRPs) are data analysis and publishing methods that, while not constituting fraud, tend to introduce bias into the final data. For example, if you run two experiments and only publish the one with data most favorable to your hypothesis, that's a QRP ('publication bias'). QRPs are very common. It's plausible that Förster used some (he has actually denied using any, but these can happen unconsciously.) This possibility has got a lot of attention. Unfortunately, I think it's very unlikely. The problem here is that QRPs serve to create statistical significance, not linearity. Linearity is orthogonal to significance. So while it's possible that Förster or someone else used QRPs to find statistical significance, that wouldn't create linearity as a side effect. Making data more significant could make it either more or less linear, and vice versa. It is possible to imagine 'linearity QRPs' that would serve to create superlinearity. The most effective one would be to selectively exclude 'outliers' from one or more groups, where 'outlier' is defined as 'point that makes the group means non-linear'. However, Förster would be behaving in a bizarre fashion if went to all the trouble of doing this and then never trumpeted the lovely linearity of his data in his papers - which he didn't. He didn't mention it. Yet the whole raison d'etre of QRPs is making data 'better' for publication. Förster has recently speculated that perhaps a research assistantused QRPs on the data to 'improve' it before sending it to him. But again, unless the assistant, inexplicably, decided to use linearity QRPs, this would not explain the results. Possibility #4 - Fabrication I will now present a hypothetical scenario. Suppose that you wanted to invent categorical 'data' showing that for three groups, A, B and C, mean A < mean B < mean C. You open up a spreadsheet and create three columns labelled 'A', 'B', 'C'. You decide that mean A will be about 5, mean B will be about 7 and mean C will be about 9 - but with some variation within each group. So under column A, you start typing a series of numbers approximating 5: maybe 5 5 4 5 6 3 5 6 7 5 5 4... and so on for B and C. Now, this would give you data with all the properties you wanted, however, it might well contain superlinearity. Because, we humans are not goodrandom number generators. We see truly random sequences as being 'not random enough'. So when we generate sequences we unconsciously make them 'super-random' - which is, objectively non-random, but subjectively random. For instance, when generating sequences of numbers, humans don't generate enough 'runs' of one digit consecutively, like 4 4 4 (repetition avoidance). Runs occur quite often in truly random data. But our minds see runs as 'patterns' so we avoid them by introducing a no-run pattern. I suggest that our psychological inability to create random numbers might make our hypothetical manual data fabricator tend to 'cancel out' high numbers with low ones - imposing symmetry, which is a form of 'super-randomness'. This would manifest, in the case of a three group experiment, as superlinearity. My hypothesis makes psychological sense, I think, and it fits with what we know about previous cases of scientific fraud: made-up data is often 'too nice' in that the variability in group means is smaller than expected, given the within-group variance. Hence the data-points must have been too symmetrical around the mean. See this analysis of Yoshitaka Fujii's 168 fabricated studies.

Back to the present case, my 'psychological' explanation does not require our fraudster (whoever he or she is) to intend to create superlinearity. In fact, as far as I am aware, it is the only scenario which allows superlinearity to emerge without conscious intent - which is a point in its favor. There are many ways to intentionally fabricate superlinear data, but I cannot see why you would want to (see my remarks in Explanation #3). In conclusion - I have considered several more or less benign explanations for the pattern of superlinear data seen in the Förster case, and I found them all wanting. This leaves only the final explanation remaining. But perhaps I have overlooked something - another possible scenario. If so, please let me know in the comments if you think so. Also, it's one thing to say that the data is fraudulent; it's another thing to say that a particular person is responsible. I am not saying anything about the latter issue. Förster in his most recent statement said that"I can not exclude the possibility that the data has been manipulated by someone [else] involved in the data collection or data processing." This possibility is certainly open.


