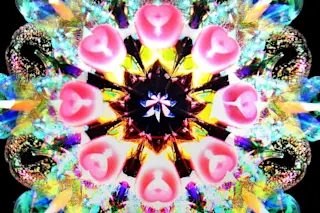
One winter evening in the early 1860s, German chemist August Kekulé dozed off while sitting before a fire, falling into a remarkably vivid dream. Atoms formed themselves into undulating strings that morphed into a snake eating its own tail. Kekulé contended that this intense imagery helped him solve the mystery of benzene’s ringlike structure, a discovery that is considered a foundation of modern chemistry.
Nearly 100 years later, research teams on both sides of the Atlantic were vying to be the first to decipher the structure of DNA, the genetic material that is the basic molecule of life. In the United States, Nobel laureate Linus Pauling found himself up against obscure English physicist Francis Crick and his 20-something American postdoc, James Watson, in Cambridge. The upstart British team had a hidden advantage: crystallographic X-rays of DNA taken by colleague Rosalind Franklin. This chemically enhanced X-ray technique revealed that DNA was composed of two complementary strands of nucleic acids linked by chemical bonds on a ladder-like chain. The ability to visualize DNA gave them insights into the spiral double-helix structure — and they won the race.
In 1993, Kary Mullis won the Nobel for his invention of polymerase chain reaction, the chemical Xerox machine that makes thousands of copies of tiny strands of DNA, a breakthrough that jump-started the biotech revolution. The biochemist, then based in Berkeley, freely admitted he conceptualized this advance while under the influence of the mind-altering drug LSD, which helped him visualize the complex chemistry three-dimensionally.
These three examples center on the power of visualization — that ability to “see” something from a different perspective, a spark of insight that pares away mountains of extraneous details and distills seemingly impenetrable puzzles down to their essence. But now we’re in the era of big data, which harnesses the computing power of massive databases with bytes measured in teras (trillions) and petas (quadrillions), combined with sophisticated algorithms that can grapple with problems on a once-unimaginable scale. While this numbers-crunching ability promises to greatly accelerate the pace of scientific discovery, we’re suddenly buried in an avalanche of information.
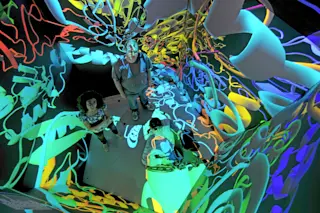
Immersive environments — 3-D virtual reality worlds — can help us make sense of this in a tangible way. Big data collects such a vast amount of information that it’s difficult to see patterns. Using computing power to translate data into something that can be seen and heard makes it easier to understand. “Scientists and engineers can work with their data, perceptually and intuitively, the way artists do,” says JoAnn Kuchera-Morin, creator of the AlloSphere. It is perhaps the most advanced of these immersive environments, housed on the campus of the University of California, Santa Barbara.