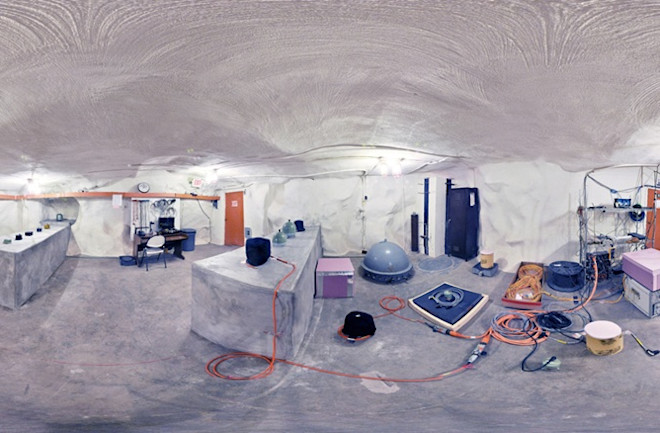
On the far southeastern edge of Albuquerque, N.M., where the Sandia Mountains rise from the Rio Grande Valley, a red door marks the entrance to an underground chamber carved into the mountainside. The door, just uphill from the Albuquerque Seismological Laboratory, leads into a cave that looks like the villain’s lair in a James Bond film: the uneven stone walls painted white, an array of shiny instruments strewn about. Some are embedded in the floor; boxes of other devices sit stacked on a metal table, ready to dispatch to hot spots throughout the world. These are the geologic stethoscopes seismologists use to detect the planet’s shakes and tremors.
“Our equipment has really evolved,” says seismologist David Wilson, who oversees the Albuquerque lab. “It’s pretty high-tech now.” So much so that last year, Ukraine was wary of installing the instruments for fear that “we’re not just recording earthquakes — that we’re keeping tabs on them somehow,” he says.
These instruments are part of the Global Seismological Network, an international system of earthquake sensors. The network is the world’s ear to the ground, designed to pick up at least some of the more than 500,000 earthquakes that occur each year. The lab, which consists of the Albuquerque facility and a monitoring center in Golden, Colo., oversees about 200 stations in 80 countries.
Natural hazard forecasting is a complex science, but whether the target is an earthquake, landslide, hurricane, tornado or flood, the goal is simple: to figure out where and when the next one will hit. Researchers analyze a mind-warping array of data that constantly stream from the sky, ocean and earth, captured by everything from satellites to drones. The advent of Doppler radar in the 1950s gave meteorologists new powers to “read” the air and transformed how they forecast tornadoes and hurricanes. Today, better simulation models and instruments and new research into geophysical and atmospheric dynamics are ushering in a new era of natural hazard forecasting.
“The advances have been tremendous,” says Roger Edwards, a forecaster with the National Weather Service, who has tracked both tornados and hurricanes. “They’ve saved thousands and thousands of lives over the years.”


