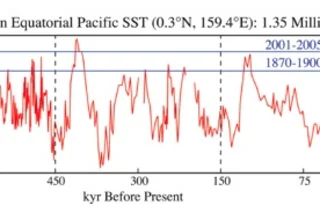
I always like to consider questions of the day from the perspective of deep time. How hot is it these days? Look back 1.35 million years, and you can see it's pretty hot. Here's a chart, published yesterday in the Proceedings of the National Academy of Sciences (free paper here). It combines historical records with geological evidence from the West Pacific to reach back 1.35 million years (kyr= thousands of years ago). The scale is telescoped near the right end, since recent warming has been so fast that it would be hard to make out its details otherwise. Two lines mark some average recent temperatures--the lower line is from 1870 to 1900, when recent global warming was just starting to kick in. The top line is from 2001 to 2005. As the record shows, the temperature has seesawed a lot over time, mainly due to the swing in and out of Ice Ages. The last time the Earth was this hot was about 400,000 years ago, and it will take a couple degree more to put us above anything that the planet has experienced in the past 1.35 million years. As the authors of the new study point out, projections based on "business-as-usual" rates of carbon dioxide emissions indicate that the planet will warm at least 2-3 degrees celsius by 2100. In other words, off the chart.
Historical Heat
Explore how global warming is unprecedented in 1.35 million years, with temperatures nearing historical highs distinctly shaped by carbon dioxide emissions.
More on Discover
Stay Curious
SubscribeTo The Magazine
Save up to 40% off the cover price when you subscribe to Discover magazine.
Subscribe


