Stunning satellite images and animations offer a sobering perspective on California's raging infernos

ImaGeo iconImaGeo
By Tom Yulsman
Nov 11, 2018 1:17 AMNov 19, 2019 10:04 PM
campfire_oli_2018312_crop.jpg

Newsletter

Sign up for our email newsletter for the latest science news
 

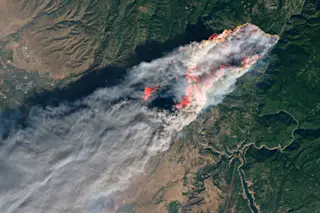
Data from the Landsat 8 satellite were used to create this image of the Camp Fire in Northern California on November 8, 2018, around 10:45 a.m. local time. (Source: NASA Earth Observatory) In all the many years that I've covered wildfire, I don't believe I've encountered anything like what we've seen with the Camp Fire blazing in California's northern Sierra Nevada mountains. What really shocked me was the speed with which this cataclysmic inferno progressed to become what appears to be the most destructive in state history. In a flash, an estimated 6,713 structures were destroyed in the town of Paradise. "It’s phenomenal how fast the fire spread," said Scott McLean, the deputy chief of the California Department of Forestry and Fire Protection, quoted in the N.Y. Times. The Landsat 8 satellite image above offers an incredible view of the inferno. It was created using Landsat bands 4-3-2 — visible light — along with shortwave-infrared light to highlight active portions of the fire. The Camp Fire started around 6:30 a.m. Pacific Standard Time, and by 8:00 p.m., it had already burned 20,000 acres. As I'm writing this on the morning of Saturday, Nov. 10, the fire has consumed 100,000 acres — half the size of New York City — and is about 20 percent contained, according to the latest update from CalFire. (Access the latest CalFire info on the fire here.) To the south, the Woolsey and Hill fires are burning just west of Los Angeles. They've so far consumed about 75,000 acres. You can see smoke from these blazes, as well as the Camp Fire, in this video: https://youtu.be/o_x3-CPIGlo Smoke from the Woolsey and Hill blazes is visible toward the bottom of the frame. The Camp Fire is toward the top.  The images making up the animation were acquired by the GOES-16 weather satellite at intervals of five minutes apart on Friday, Nov. 9. I created the animation using the RealEarth data discovery and visualization platform developed by Space Science and Engineering Center and Cooperative Institute for Meteorological Satellite Studies at the University of Wisconsin-Madison. Next up: a static image showing all of California:

A satellite view taking in all of California shows smoke plumes from multiple wildfires. Please click on the image to zero in close on areas of interest. (Source: NASA Earth Observatory) NASA's Terra satellite captured this natural-color image of a large portion of the western United States on November 9th. Smoke plumes are clearly visible from the three fires — the Camp Fire in the Sierra Nevada to the north, and the infernos near Los Angels to the south. Smoke from another fire is also visible, in the southern Sierra Nevada. https://youtu.be/xZjX1sFg_G8 The animation above shows a closer view of the Woolsey and Hill fires. I created it using an interactive tool from NOAA's Regional and Mesoscale Meteorology Branch. It consists of GOES-16 weather satellite imagery, acquired at intervals of just one minute apart, giving it an almost cinematic quality. Next, a static view of the fires showing them in greater detail:

Satellite view of wildfires burning near Los Angeles on Nov. 9, 2018. (Source: NASA Worldview) The image above comes from NASA's Terra satellite. Smoke from the Woolsey and Hill fires is seen streaming south over the ocean. To get a sense of scale, check out the developed area just to the east (right) of the fires. This is Los Angeles. Back up to the north again, here's another view of the Camp Fire:

Satellite view of the Camp Fire in Northern California. (Source: NOAA) Plumes of smoke from the blaze are seen stretching across a large swath of Northern California in this NOAA-20 satellite image acquired on Thursday, Nov. 8, 2018 at 8:40 p.m. PT. Here's how NOAA describes the technical details of the image:

[It] was created by combining three of the high resolution thermal and visible channels from the VIIRS sensor on-board NOAA-20. These channels (known as SVI 4,2,1 RGB) allow us to distinguish different land types and features based on their visual and thermal differences. Areas of land that are hotter in temperature due to an active fire or burn scar appear dark red in the imagery. Smoke from the Camp Fire blowing toward the Pacific appears in shades of gray and white.

Now, another animation: https://twitter.com/NOAASatellites/status/1060888406073503745 This one was posted to Twitter by NOAA. It shows smoke streaming to the southwest from the Camp Fire on November 8, as well as the heat signature from the blaze, in orange. The imagery are made up of both visible and infrared data. Conditions were ripe for these fires. For 2018 through the end of October, California experienced its third warmest conditions in records that go back to 1895, according to NOAA. Conditions have also been quite dry https://twitter.com/pppapin/status/1061071774769602560 The final ingredient in the climatological and meteorological stew was an upper level ridge of high pressure over California that triggered very strong Santa Ana winds. Click on the animation above to see what that has looked like. As Philippe Papin, a PhD student in atmospheric sciences, points out in his Tweet above, things could get worse soon: a stronger ridging event is forecast for next week. And unless we get a handle on our emissions of greenhouse gases, which continue to warm the planet, over the long run, things will get much worse. As California's Fourth Climate Change Assessment puts it:

By 2100, if greenhouse gas emissions continue to rise, one study found that the frequency of extreme wildfires would increase, and the average area burned statewide would increase by 77 percent. In the areas that have the highest fire risk, wildfire insurance is estimated to see costs rise by 18 percent by 2055.

1 free article left
Want More? Get unlimited access for as low as $1.99/month

Already a subscriber?

Register or Log In

1 free articleSubscribe
Discover Magazine Logo
Want more?

Keep reading for as low as $1.99!

Subscribe

Already a subscriber?

Register or Log In

More From Discover
Recommendations From Our Store
Shop Now
Stay Curious
Join
Our List

Sign up for our weekly science updates.

 
Subscribe
To The Magazine

Save up to 40% off the cover price when you subscribe to Discover magazine.

Copyright © 2024 Kalmbach Media Co.