May 25, 2001 May 25, 2001Longwave radiation (thermal) Shortwave radiation (light)
Photographs courtesy of NASA/Goddard Space Flight Center (2)
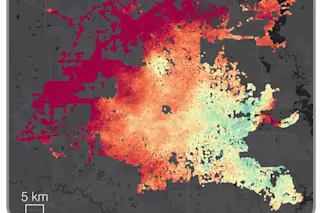
Earth's energy budget— the solar radiation it absorbs minus the heat the planet loses to space— controls the weather and determines whether global warming will occur. The CERES instruments on NASA's Terra satellite are providing a detailed look at this pulse of our planet (see visibleearth.nasa.gov/Sensors/Terra). One kind of CERES map depicts where Earth releases thermal energy, with the areas of greatest heat output depicted as bright yellow (left). A bright yellow patch over the Middle East denotes a major heat wave that killed dozens of people. A second type of map illustrates how much sunlight the planet reflects (right). Northern latitudes appear notably bright because Earth's axis tilts these areas into continuous sunlight in summer. The brightest areas in the sunlight map often appear dark in the thermal image: Less ...


