Ok Arctic, You Can Take Your Ice Back. You Need It Badly.

ImaGeo iconImaGeo
By Tom Yulsman
Feb 22, 2014 4:57 AMNov 20, 2019 3:41 AM
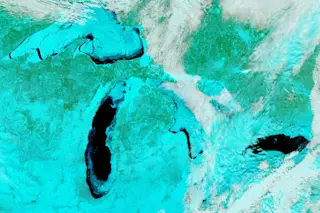
Great-Lakes-False-Color-1024x787.jpg

Newsletter

Sign up for our email newsletter for the latest science news
 

A false-color image captured by NASA's Aqua satellite on Feb. 19, 2014, when ice covered 80 percent of the the Great Lakes. This color scheme helps distinguish ice from snow, water, and clouds. Ice appears pale blue. (Source: NASA) If I had to pick a word of the week it would probably be "ice" — an abundance of it in the Great Lakes and a lack up in parts of the Arctic. That icy dichotomy pretty much captures the essence of the strange winter we've been having this winter. The satellite image above, acquired by NASA's Aqua satellite on Feb. 19, shows the Great Lakes in false color (bands 7-2-1 on the MODIS instrument). Ice cover shows up pale blue, open water is navy blue, snow is blue-green, and clouds are white or blue-green. In mid-February, ice cover on the Great Lakes reached 88 percent, according to NASA, well above the average maximum extent of ice: 50 percent. Ice cover over 80 percent is very rare, having occurred only five times in the past four decades.

Warming temperatures have caused the ice to pull back a bit to 80 percent as of Feb. 19. But now, another Arctic blast appears to be taking aim on the U.S. midsection, with frigid temperatures forecast to hit the north central United States this weekend. (Click on the thumbnail at right to see the temperature outlook for Feb. 27 through March 3.) Meanwhile, up where all this cold air is supposed to be coming from, the normal wintertime expansion of Arctic sea ice has slowed dramatically. Climate Central reports that sea ice extent as of Feb. 18 was at a record low level for mid-February. Here's why:

Air temperatures over a large part of the Arctic have been abnormally warm through most of February. (Source: NOA/ESRL) The map shows how temperatures have departed from the long-term average from Feb. 1st through the 18th. One anomalously warm area stands out: the red and orange spot located in the Barents Sea by Svalbard. (Click here for a Google map pinpointing Svalbard.) At the heart of this area, temperatures have averaged more than 20 degrees F warmer than normal. The unusual warmth also has extended into the Sea of Okhotsk off the northwest coast of Russia. (A map.)

Source: NSIDC These areas are typically covered in sea ice in February. But they are ice free now, as the graphic to the left shows (click on the thumbnail for a larger version). The orange line marks the median extent of Arctic sea ice for Feb. 20, 2014. Open water is present near Svalbard and in the Sea of Okhotsk. As Brian Kahn notes in his story at Climate Central:

The decline in sea ice is one of the key indicators of climate change. Sea ice in January, the last full month for which data is available, has declined 3.2 percent per decade since 1979 compared to the 1981-2012 average. That equals roughly 18,500 square miles in ice lost per decade, the same area as Vermont and New Hampshire combined. This past January ranked as the fourth-lowest year on record, with 2011 being the all-time record lowest.

As Arctic sea ice has shrunk, its average age has also gotten younger. Younger ice tends to be thinner, and thus more prone to breaking up and melting. http://www.youtube.com/watch?v=H-BbPBg3vj8 Click to watch this animation of sea ice age from 1987 through the end of October 2013. By the end of the animation it's clear that very little of the oldest ice remains. Even as human-caused climate change causes Arctic sea ice to shrivel, that in turn seems to be enhancing warming in the region. It happens through something called "albedo" — the amount of light that a surface reflects. Ice has a high albedo. This means it tends to reflect a large proportion of the sun's energy that hits it back into space. When there's a lot of ice present (and snow too), that albedo effect tends to reinforce cold temperatures. But when the ice melts, dark water with a low albedo is exposed. Much of the incoming solar energy is absorbed by the water, which then gives part of it back to the atmosphere in the form of heat. This tends to reinforce warming. And that appears to be what has been happening in the Arctic region, which has been warming faster than other parts of the globe. New research published this week in the Proceedings of the National Academy of Sciences suggests that this so-called Arctic amplification effect, hypothesized nearly 50 years ago, is considerably larger than climate models have predicted. The researchers found that thanks to shrinking sea ice, the albedo of the Arctic has decreased by about 50 percent since 1979. This in turn has resulted in a considerable amount of solar energy being added to the Arctic Ocean region (6.4 ± 0.9 W/m2). Averaged over the globe, the heat buildup from the decrease of Arctic albedo, if averaged over the globe, is equal to 25 percent of the warming due to the increase in carbon dioxide in the atmosphere since 1979. That's huge.

1 free article left
Want More? Get unlimited access for as low as $1.99/month

Already a subscriber?

Register or Log In

1 free articleSubscribe
Discover Magazine Logo
Want more?

Keep reading for as low as $1.99!

Subscribe

Already a subscriber?

Register or Log In

More From Discover
Recommendations From Our Store
Stay Curious
Join
Our List

Sign up for our weekly science updates.

 
Subscribe
To The Magazine

Save up to 40% off the cover price when you subscribe to Discover magazine.

Copyright © 2024 LabX Media Group