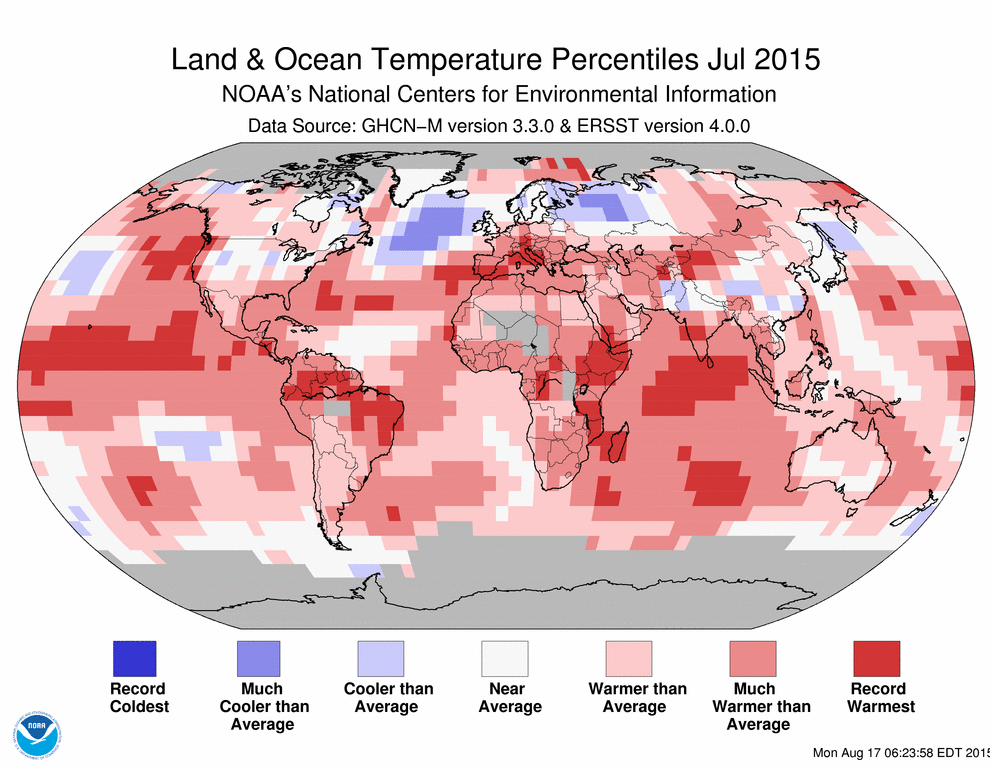
Last week, analyses by NASA and the Japan Meteorological Agency showed that July 2015 was the warmest such month on record. Now, the National Oceanic Atmospheric Administration concurs. But that's not all. NOAA's latest monthly report finds that no other month since 1880 has been warmer globally than July 2015. As my headline states, this past month was the warmest among 1,627 on record.
While large portions of Earth's land surfaces were much warmer than average, that wasn't the only contributor to July's record setting global temperature. The oceans were an even bigger contributor. According to NOAA's report:
For the oceans, the July global sea surface temperature was 0.75°C (1.35°F) above the 20^th century average of 16.4°C (61.5°F), the highest departure not only for July, but for any month on record. The 10 highest monthly departures from average for the oceans have all occurred in the past 16 months (since April 2014).
Very warm temperatures in the equatorial Pacific Ocean associated with El Niño are partially to blame. In fact, record warmth "is notable across much of this area," NOAA says.
But El Niño in the Pacific is not the only culprit:
Other areas across the world's ocean surfaces also experienced record warmth or much warmer-than-average conditions, including all of the Indian Ocean, most of the eastern and equatorial Pacific, various regions of the North and South Atlantic, and the Barents Sea in the Arctic.
“I would say [we’re] 99 percent certain that it’s going to be the warmest year on record,” says Jessica Blunden, a climate scientist with ERT, Inc., quoted by Climate Central. There's other climate news worth noting today too: https://twitter.com/NASA_EO/status/634406096606642176 The NASA animation in the Tweet above shows dramatic ice loss from the Jakobshavn Glacier in Greenland. The glacier drains a large portion of the Greenland Ice Sheet. By itself, this one glacier could add more to sea level rise than any other single feature in the Northern Hemisphere. The animation consists of images acquired 16 days apart this summer by the Landsat 8 satellite. One image shows the position of the glacier’s front on July 31, and the other on August 16 — after a very large amount of ice calved into the water. “The calving events of Jakobshavn are becoming more spectacular with time, and I am in awe with the calving speed and retreat rate of this glacier,” says Eric Rignot, a glaciologist at the Jet Propulsion Laboratory, quoted in a NASA Earth Observatory post. “These images are a very good example of the changes taking place in Greenland.” Note: A previous version of this story incorrectly stated that there were 1,626 months in the climate record dating back to 1880. The story has been corrected to reflect the correct number: 1,627.


